L
Seller's Agent in 2014
LEANNE DUNCAN
FEDERATED MANAGEMENT GROUP, INC
Estimated Value: $382,240 - $493,000
Please note, our homes are available on a first-come, first-serve basis and are not reserved until the lease is signed by all applicants and security deposits are collected.
This home features Progress Smart Home - Progress Residential's smart home app, which allows you to control the home securely from any of your devices. Learn more at
Want to tour on your own? Click the “Self Tour” button on this home’s listing or call to register for a self-guided showing at a time that works best for you.
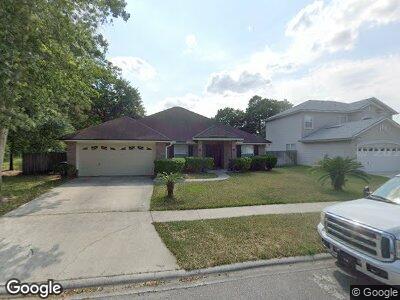
A number of charms await you inside this three-bedroom and two-bathroom rental home in Jacksonville, FL. Your tour of this modern smart home begins in the expansive living room, which has stylish flooring and a lighted ceiling fan to supplement the home's central HVAC. Step out the sliding glass doors to find the covered back patio outside. Spread out in the home's luxurious kitchen, where you'll have a serving bar and a center island for convenience. You'll have ample storage space in the pantry. With soft carpeting, two windows, and a ceiling fan, the main bedroom suite has a number of great features. Two separate vanities, a garden tub, and a shower await you inside the en suite bathroom. Book a personal walk-through of this home today!
| Date | Buyer | Sale Price | Title Company |
|---|---|---|---|
| Progressive Residential 2014 1 Borrowers | -- | None Available | |
| Freo Florida Llc | $157,300 | None Available | |
| Freo Florida Llc | $157,300 | None Available | |
| Danner Mary H | $195,100 | -- |
| Date | Status | Borrower | Loan Amount |
|---|---|---|---|
| Open | Progress Residential Borrower 5 Llc | $1,447,545 | |
| Open | Progress Residential 2014 1 Borrower Llc | $473,218,000 | |
| Previous Owner | Danner Mary H | $113,544 | |
| Previous Owner | Danner Mary H | $75,607 | |
| Previous Owner | Danner Mary H | $156,000 | |
| Closed | Danner Mary H | $39,000 |
| Date | Event | Price | Change | Sq Ft Price |
|---|---|---|---|---|
| 04/14/2025 04/14/25 | Off Market | $2,365 | -- | -- |
| 04/08/2025 04/08/25 | Price Changed | $2,365 | -1.0% | $1 / Sq Ft |
| 04/01/2025 04/01/25 | Price Changed | $2,390 | -2.0% | $1 / Sq Ft |
| 03/25/2025 03/25/25 | Price Changed | $2,440 | -3.0% | $1 / Sq Ft |
| 03/16/2025 03/16/25 | Price Changed | $2,515 | +3.1% | $1 / Sq Ft |
| 03/14/2025 03/14/25 | Price Changed | $2,440 | +2.7% | $1 / Sq Ft |
| 03/12/2025 03/12/25 | Price Changed | $2,375 | -0.2% | $1 / Sq Ft |
| 03/11/2025 03/11/25 | Price Changed | $2,380 | +0.6% | $1 / Sq Ft |
| 03/05/2025 03/05/25 | Price Changed | $2,365 | -0.8% | $1 / Sq Ft |
| 03/01/2025 03/01/25 | Price Changed | $2,385 | +0.8% | $1 / Sq Ft |
| 02/15/2025 02/15/25 | Price Changed | $2,365 | -3.7% | $1 / Sq Ft |
| 02/09/2025 02/09/25 | Price Changed | $2,455 | +0.2% | $1 / Sq Ft |
| 02/07/2025 02/07/25 | Price Changed | $2,450 | +0.2% | $1 / Sq Ft |
| 02/06/2025 02/06/25 | Price Changed | $2,445 | +0.2% | $1 / Sq Ft |
| 02/06/2025 02/06/25 | Price Changed | $2,440 | +2.3% | $1 / Sq Ft |
| 01/20/2025 01/20/25 | Price Changed | $2,385 | +0.2% | $1 / Sq Ft |
| 01/17/2025 01/17/25 | Price Changed | $2,380 | +0.6% | $1 / Sq Ft |
| 01/16/2025 01/16/25 | Price Changed | $2,365 | -28.1% | $1 / Sq Ft |
| 01/14/2025 01/14/25 | For Rent | $3,290 | +120.1% | -- |
| 12/17/2023 12/17/23 | Off Market | $1,495 | -- | -- |
| 05/14/2014 05/14/14 | Rented | $1,495 | 0.0% | -- |
| 04/30/2014 04/30/14 | Under Contract | -- | -- | -- |
| 04/28/2014 04/28/14 | For Rent | $1,495 | -- | -- |
| Year | Tax Paid | Tax Assessment Tax Assessment Total Assessment is a certain percentage of the fair market value that is determined by local assessors to be the total taxable value of land and additions on the property. | Land | Improvement |
|---|---|---|---|---|
| 2024 | $5,877 | $340,606 | $95,000 | $245,606 |
| 2023 | $5,603 | $342,988 | $85,000 | $257,988 |
| 2022 | $4,844 | $315,888 | $70,000 | $245,888 |
| 2021 | $4,214 | $229,713 | $60,000 | $169,713 |
| 2020 | $4,117 | $222,826 | $55,000 | $167,826 |
| 2019 | $4,169 | $222,482 | $55,000 | $167,482 |
| 2018 | $3,918 | $206,654 | $40,000 | $166,654 |
| 2017 | $3,833 | $199,585 | $35,000 | $164,585 |
| 2016 | $3,721 | $189,988 | $0 | $0 |
| 2015 | $3,472 | $173,526 | $0 | $0 |
| 2014 | $2,399 | $155,893 | $0 | $0 |
L
Seller's Agent in 2014
LEANNE DUNCAN
FEDERATED MANAGEMENT GROUP, INC