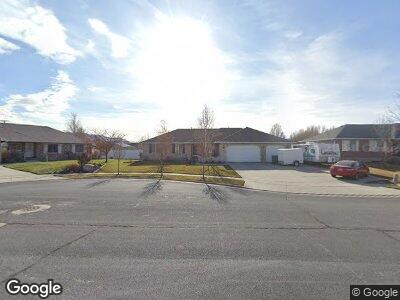
1257 W Margaret View Cir Riverton, UT 84065
Estimated Value: $738,000 - $844,000
6
Beds
4
Baths
3,694
Sq Ft
$216/Sq Ft
Est. Value
About This Home
This home is located at 1257 W Margaret View Cir, Riverton, UT 84065 and is currently estimated at $797,701, approximately $215 per square foot. 1257 W Margaret View Cir is a home located in Salt Lake County with nearby schools including Rosamond Elementary School, Oquirrh Hills Middle School, and Riverton High School.
Ownership History
Date
Name
Owned For
Owner Type
Purchase Details
Closed on
May 24, 2016
Sold by
Sorensen Sheri and Michael Sorensen L
Bought by
Sorensen Sheri and Michael Sorensen L
Current Estimated Value
Purchase Details
Closed on
Dec 31, 2012
Sold by
Sorensen Sheri and Michael Sorensen L
Bought by
Llambert Jay C and Lambert Kayleen
Home Financials for this Owner
Home Financials are based on the most recent Mortgage that was taken out on this home.
Original Mortgage
$316,000
Interest Rate
3.58%
Mortgage Type
New Conventional
Purchase Details
Closed on
Sep 10, 2008
Sold by
Sorensen Sheri M
Bought by
Sorensen Sheri and Michael Sorensen L
Purchase Details
Closed on
Jun 10, 1999
Sold by
Ron Thorne Construction Inc
Bought by
Sorensen Sheri M
Home Financials for this Owner
Home Financials are based on the most recent Mortgage that was taken out on this home.
Original Mortgage
$167,700
Interest Rate
6.9%
Mortgage Type
Stand Alone First
Create a Home Valuation Report for This Property
The Home Valuation Report is an in-depth analysis detailing your home's value as well as a comparison with similar homes in the area
Home Values in the Area
Average Home Value in this Area
Purchase History
| Date | Buyer | Sale Price | Title Company |
|---|---|---|---|
| Sorensen Sheri | -- | Premium Title & Escrow | |
| Llambert Jay C | -- | Premium Title & Escrow | |
| Sorensen Sheri | -- | None Available | |
| Sorensen Sheri M | -- | Merrill Title |
Source: Public Records
Mortgage History
| Date | Status | Borrower | Loan Amount |
|---|---|---|---|
| Previous Owner | Llambert Jay C | $316,000 | |
| Previous Owner | Sorensen Sheri M | $167,700 |
Source: Public Records
Tax History Compared to Growth
Tax History
| Year | Tax Paid | Tax Assessment Tax Assessment Total Assessment is a certain percentage of the fair market value that is determined by local assessors to be the total taxable value of land and additions on the property. | Land | Improvement |
|---|---|---|---|---|
| 2023 | $4,142 | $675,800 | $249,600 | $426,200 |
| 2022 | $4,316 | $690,800 | $244,700 | $446,100 |
| 2021 | $3,723 | $530,600 | $207,500 | $323,100 |
| 2020 | $3,521 | $467,800 | $206,400 | $261,400 |
| 2019 | $3,487 | $455,500 | $203,200 | $252,300 |
| 2018 | $3,315 | $426,300 | $139,400 | $286,900 |
| 2017 | $2,850 | $357,200 | $139,400 | $217,800 |
| 2016 | $2,772 | $333,400 | $139,400 | $194,000 |
| 2015 | $2,868 | $334,400 | $159,600 | $174,800 |
| 2014 | $2,707 | $309,400 | $149,400 | $160,000 |
Source: Public Records
Map
Nearby Homes
- 1381 Quail Covey Cir
- 12359 Overlook Ridge Ct
- 1343 W Stewart Falls Dr
- 12244 High Creek Cir
- 12416 Tithing Point Dr
- 1480 W 12330 S
- 12185 S Meadow Park Cir
- 1255 W Hendrix St Unit 147
- 1273 W Hendrix St Unit 145
- 12736 S Mccartney Way Unit 104
- 1568 W Big Var Way
- 1056 W Kate Springs Ln S Unit 10
- 1261 W Moon Way Unit 133
- 1259 W Moon Way Unit 134
- 1263 W Moon Way Unit 132
- 12076 River Vista Dr
- 12021 Misty Sea Rd
- 1256 W Frank Ln Unit 126
- 1265 W Frank Ln Unit 114
- 12014 Meadow Ridge Cir