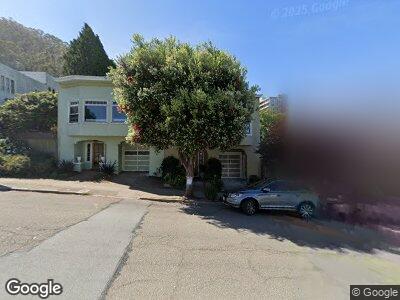
127 Kirkham St San Francisco, CA 94122
Forest Knolls NeighborhoodEstimated Value: $1,570,000 - $1,728,000
2
Beds
1
Bath
1,350
Sq Ft
$1,233/Sq Ft
Est. Value
About This Home
This home is located at 127 Kirkham St, San Francisco, CA 94122 and is currently estimated at $1,664,351, approximately $1,232 per square foot. 127 Kirkham St is a home located in San Francisco County with nearby schools including Clarendon Alternative Elementary School, Presidio Middle School, and St Anne School.
Ownership History
Date
Name
Owned For
Owner Type
Purchase Details
Closed on
Nov 13, 2007
Sold by
Pappas Theresa C
Bought by
Pappas Theresa C
Current Estimated Value
Purchase Details
Closed on
Apr 6, 2005
Sold by
Grant Todd H and Komachi Robyn R
Bought by
Pappas Theresa C
Home Financials for this Owner
Home Financials are based on the most recent Mortgage that was taken out on this home.
Original Mortgage
$772,000
Interest Rate
5.62%
Mortgage Type
Fannie Mae Freddie Mac
Purchase Details
Closed on
Jul 31, 2000
Sold by
Grant Todd H and Komachi Robyn R
Bought by
Grant Todd H and Komachi Robyn R
Purchase Details
Closed on
Dec 4, 1998
Sold by
Groom Peter E
Bought by
Grant Todd H and Komachi Robyn R
Home Financials for this Owner
Home Financials are based on the most recent Mortgage that was taken out on this home.
Original Mortgage
$348,000
Interest Rate
6.78%
Create a Home Valuation Report for This Property
The Home Valuation Report is an in-depth analysis detailing your home's value as well as a comparison with similar homes in the area
Home Values in the Area
Average Home Value in this Area
Purchase History
| Date | Buyer | Sale Price | Title Company |
|---|---|---|---|
| Pappas Theresa C | -- | None Available | |
| Pappas Theresa C | $965,000 | Fidelity National Title Co | |
| Grant Todd H | -- | -- | |
| Grant Todd H | $435,000 | Fidelity National Title Co |
Source: Public Records
Mortgage History
| Date | Status | Borrower | Loan Amount |
|---|---|---|---|
| Open | Pappas Theresa C | $634,000 | |
| Closed | Pappas Theresa C | $640,600 | |
| Closed | Pappas Theresa C | $777,000 | |
| Closed | Pappas Theresa C | $800,000 | |
| Closed | Pappas Theresa C | $772,000 | |
| Closed | Pappas Theresa C | $772,000 | |
| Closed | Pappas Theresa C | $772,000 | |
| Previous Owner | Grant Todd H | $348,000 | |
| Closed | Pappas Theresa C | $96,500 |
Source: Public Records
Tax History Compared to Growth
Tax History
| Year | Tax Paid | Tax Assessment Tax Assessment Total Assessment is a certain percentage of the fair market value that is determined by local assessors to be the total taxable value of land and additions on the property. | Land | Improvement |
|---|---|---|---|---|
| 2024 | $16,155 | $1,318,736 | $819,943 | $498,793 |
| 2023 | $15,910 | $1,292,879 | $803,866 | $489,013 |
| 2022 | $15,604 | $1,267,529 | $788,104 | $479,425 |
| 2021 | $15,325 | $1,242,676 | $772,651 | $470,025 |
| 2020 | $15,397 | $1,229,935 | $764,729 | $465,206 |
| 2019 | $14,868 | $1,205,820 | $749,735 | $456,085 |
| 2018 | $14,366 | $1,182,178 | $735,035 | $447,143 |
| 2017 | $13,897 | $1,158,999 | $720,623 | $438,376 |
| 2016 | $13,668 | $1,136,275 | $706,494 | $429,781 |
| 2015 | $13,498 | $1,119,208 | $695,882 | $423,326 |
| 2014 | $11,999 | $1,000,000 | $600,000 | $400,000 |
Source: Public Records
Map
Nearby Homes
- 1420 6th Ave
- 1416 7th Ave
- 1456 9th Ave
- 326 Irving St
- 1352 10th Ave Unit 203
- 1352 10th Ave Unit 102
- 1808 8th Ave
- 1810 8th Ave
- 1015 Irving St
- 683 Frederick St
- 1306 Funston Ave
- 1480 Willard St
- 1843 10th Ave
- 1209 Stanyan St
- 1208 Stanyan St
- 620 Clarendon Ave
- 154 Lomita Ave
- 1039 Judah St
- 1660 16th Ave
- 1328 16th Ave