NOT LISTED FOR SALE

Estimated Value: $484,898 - $506,000

4 Beds
3 Baths
2,651 Sq Ft
$188/Sq Ft Est. Value

Last Sold February 28, 2025

Last sale price $505,000 $190 Per Sq Ft

Est. 1% decrease in value since last sale

Current estimated payment $3,919/month

About This Home

As of February 2025

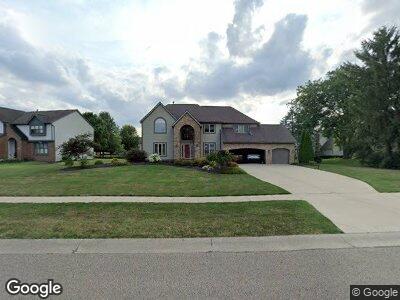
This home is located at 12751 Oakmere Dr, Pickerington, OH 43147 and is currently estimated at $499,225, approximately $188 per square foot. 12751 Oakmere Dr is a home located in Fairfield County with nearby schools including Fairfield Elementary School, Harmon Middle School, and Pickerington Lakeview Junior High School.

Ownership History

Date Name Owned For Owner Type

Purchase Details

Closed on
Feb 28, 2025
Sold by
Holland Michael R and Holland Melissa J
Bought by
Andrews Jeremy and Erdeljac Nicole A
Current Estimated Value
$499,225

Home Financials for this Owner

Home Financials are based on the most recent Mortgage that was taken out on this home.
Original Mortgage
$479,750
Outstanding Balance
$479,360
Interest Rate
7.04%
Mortgage Type
New Conventional
Estimated Equity
$19,865

Purchase Details

Closed on
Oct 31, 1997
Sold by
Stone Mitchell T
Bought by
Holland Michael R and Holland Melissa J

Purchase Details

Closed on
Dec 18, 1991
Bought by
Stone Mitchell T

Range of Values:

Collateral Analytics

Collateral Analytics Collateral Analytics AVMs (Automated Valuation Model) employ a number of statistical approaches combined with neighborhood-specific comparable selection guarantees the most up-to-date and precise valuations.

Not Available

Collateral Analytics does not have data for the current month. Please view the chart for historical values.

ICE

ICE Mortgage Technology ICE Mortgage Technology’s AVM (Automated Valuation Model) is a state-of-the-art online residential property valuation tool that provides a quick and accurate estimate of the value of almost any home in the U.S.

Not Available

ICE Mortgage Technology does not have data for the current month. Please view the chart for historical values.

First American

First American First American Data & Analytics’ next-generation AVM combines unrivaled data assets with a blended ensemble of valuation models to produce highly accurate, reliable valuations you can trust.

Not Available

First American does not have data for the current month. Please view the chart for historical values.

Quantarium

Quantarium Quantarium’s valuation service, repeatedly proven the industry’s most accurate and comprehensive, is supercharged with a self-learning and auto-tuning AI engine that continually becomes smarter and more accurate as it processes daily inputs from the industry’s leading RE data lake.

Not Available

Quantarium does not have data for the current month. Please view the chart for historical values.

Average Value
Not Available
List Price
Sold Price
Create a Home Valuation Report for This Property
The Home Valuation Report is an in-depth analysis detailing your home's value as well as a comparison with similar homes in the area

Home Values in the Area

Source: Public Records

Average Home Value in this Area


Source: Public Records

Purchase History

Date Buyer Sale Price Title Company
Andrews Jeremy $505,000 None Listed On Document
Holland Michael R $210,000 --
Stone Mitchell T $176,400 --
Source: Public Records

Mortgage History

Date Status Borrower Loan Amount
Open Andrews Jeremy $479,750
Previous Owner Holland Michael R $102,800
Source: Public Records

Property History

Date Event Price Change Sq Ft Price
02/28/2025 02/28/25 Sold $505,000 +3.1% $190 / Sq Ft
02/02/2025 02/02/25 For Sale $489,900 -- $185 / Sq Ft

Tax History Compared to Growth

Source: Public Records

Tax History

Year Tax Paid Tax Assessment Tax Assessment Total Assessment is a certain percentage of the fair market value that is determined by local assessors to be the total taxable value of land and additions on the property. Land Improvement
2024 $13,588 $114,670 $18,600 $96,070
2023 $5,217 $114,670 $18,600 $96,070
2022 $5,233 $114,670 $18,600 $96,070
2021 $4,865 $90,810 $16,910 $73,900
2020 $4,918 $90,810 $16,910 $73,900
2019 $4,950 $90,810 $16,910 $73,900
2018 $5,174 $78,370 $16,910 $61,460
2017 $5,181 $82,920 $15,220 $67,700
2016 $5,152 $82,920 $15,220 $67,700
2015 $4,763 $74,280 $12,680 $61,600
2014 $4,701 $74,280 $12,680 $61,600
2013 $4,701 $74,280 $12,680 $61,600
Source: Public Records

Agents Affiliated with this Home

  • Section Image
  • Section Image
See All Agents

Map