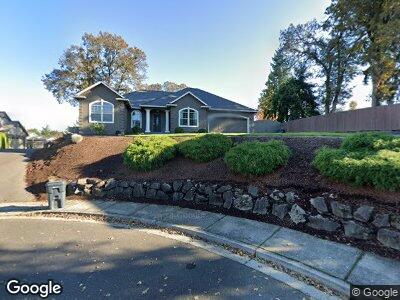
1282 Barnabas St NW Salem, OR 97304
West Salem NeighborhoodEstimated Value: $521,000 - $559,000
3
Beds
2
Baths
2,043
Sq Ft
$263/Sq Ft
Est. Value
About This Home
This home is located at 1282 Barnabas St NW, Salem, OR 97304 and is currently estimated at $537,301, approximately $262 per square foot. 1282 Barnabas St NW is a home located in Polk County with nearby schools including Chapman Hill Elementary School, Straub Middle School, and West Salem High School.
Ownership History
Date
Name
Owned For
Owner Type
Purchase Details
Closed on
Oct 28, 2020
Sold by
Brenneke James L and Laymon Joann E
Bought by
Brenneke James and Laymon Joann
Current Estimated Value
Home Financials for this Owner
Home Financials are based on the most recent Mortgage that was taken out on this home.
Original Mortgage
$325,000
Outstanding Balance
$295,080
Interest Rate
2.8%
Mortgage Type
New Conventional
Estimated Equity
$256,970
Purchase Details
Closed on
Oct 8, 2010
Sold by
Brenneke James L and Laymon Joann E
Bought by
Brenneke James L and Laymon Joann E
Home Financials for this Owner
Home Financials are based on the most recent Mortgage that was taken out on this home.
Original Mortgage
$224,000
Interest Rate
4.26%
Mortgage Type
New Conventional
Purchase Details
Closed on
Mar 15, 2005
Sold by
Bridger Creek Inc
Bought by
Brenneke James L and Laymon Joanne E
Home Financials for this Owner
Home Financials are based on the most recent Mortgage that was taken out on this home.
Original Mortgage
$230,000
Interest Rate
5.53%
Mortgage Type
Purchase Money Mortgage
Create a Home Valuation Report for This Property
The Home Valuation Report is an in-depth analysis detailing your home's value as well as a comparison with similar homes in the area
Home Values in the Area
Average Home Value in this Area
Purchase History
| Date | Buyer | Sale Price | Title Company |
|---|---|---|---|
| Brenneke James | -- | None Available | |
| Brenneke James L | -- | First American Title | |
| Brenneke James L | $72,800 | Fidelity National Title |
Source: Public Records
Mortgage History
| Date | Status | Borrower | Loan Amount |
|---|---|---|---|
| Open | Brenneke James | $325,000 | |
| Closed | Brenneke James L | $250,000 | |
| Closed | Brenneke James L | $224,000 | |
| Closed | Laymon Joanne E | $37,000 | |
| Closed | Brenneke James L | $50,000 | |
| Closed | Brenneke James L | $230,000 |
Source: Public Records
Tax History Compared to Growth
Tax History
| Year | Tax Paid | Tax Assessment Tax Assessment Total Assessment is a certain percentage of the fair market value that is determined by local assessors to be the total taxable value of land and additions on the property. | Land | Improvement |
|---|---|---|---|---|
| 2025 | $6,212 | $339,490 | $81,800 | $257,690 |
| 2024 | $6,212 | $329,610 | $79,420 | $250,190 |
| 2023 | $6,031 | $320,010 | $77,100 | $242,910 |
| 2022 | $5,838 | $310,690 | $74,860 | $235,830 |
| 2021 | $5,672 | $301,650 | $72,680 | $228,970 |
| 2020 | $5,503 | $292,870 | $70,560 | $222,310 |
| 2019 | $5,311 | $284,340 | $68,510 | $215,830 |
| 2018 | $5,223 | $276,060 | $66,520 | $209,540 |
| 2017 | $4,707 | $268,020 | $64,580 | $203,440 |
| 2016 | $4,595 | $260,220 | $62,690 | $197,530 |
| 2015 | $4,634 | $252,650 | $60,870 | $191,780 |
| 2014 | $4,385 | $245,300 | $59,100 | $186,200 |
Source: Public Records
Map
Nearby Homes
- 1293 Westbrook Dr NW
- 1229 14th Ave NW
- 1367 Westbrook Dr NW
- 1544 Willie Way NW
- 1050 Cardinal St NW
- 1778 Sunburst Terrace NW
- 1465 Ranier Loop NW
- 1521 Saint Helens St NW
- 1022 Pali Dr NW
- 895 Hilltop Dr NW
- 1656 Ashland Ct NW
- 996 Parkway Dr NW
- 1795 Montrose Ave NW
- 1380 Ranier Loop NW
- 865 Glen Creek Rd NW
- 1832 Chapman Hill Dr NW
- 1385 Moonbeam Ct NW
- 1417 Orchard Heights Rd NW
- 941 Cascade Dr NW
- 1575 Mousebird Ave NW