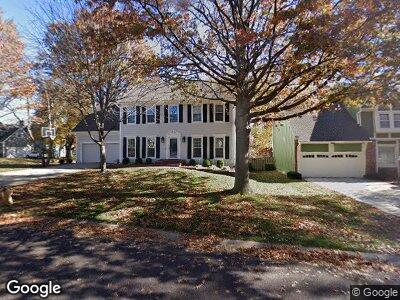
12903 Connell Dr Overland Park, KS 66213
Nottingham NeighborhoodEstimated Value: $520,906 - $564,000
5
Beds
4
Baths
2,816
Sq Ft
$195/Sq Ft
Est. Value
About This Home
This home is located at 12903 Connell Dr, Overland Park, KS 66213 and is currently estimated at $548,477, approximately $194 per square foot. 12903 Connell Dr is a home located in Johnson County with nearby schools including Cottonwood Point Elementary School, Oxford Middle, and Blue Valley Northwest High School.
Ownership History
Date
Name
Owned For
Owner Type
Purchase Details
Closed on
Jun 16, 2023
Sold by
Perryman Jason M and Perryman Jessica E
Bought by
Jason M And Jessica E Perryman Revocable Livi
Current Estimated Value
Purchase Details
Closed on
Apr 1, 2015
Sold by
Cope Mitchell E and Cope Jennifer L
Bought by
Perryman Jesscia E and Perryman Jason M
Home Financials for this Owner
Home Financials are based on the most recent Mortgage that was taken out on this home.
Original Mortgage
$284,400
Interest Rate
3.88%
Mortgage Type
VA
Purchase Details
Closed on
Dec 3, 2002
Sold by
Cope Mitchell E and Cope Jennifer L
Bought by
Cope Mitchell E and Cope Jennifer L
Home Financials for this Owner
Home Financials are based on the most recent Mortgage that was taken out on this home.
Original Mortgage
$145,000
Interest Rate
6.05%
Create a Home Valuation Report for This Property
The Home Valuation Report is an in-depth analysis detailing your home's value as well as a comparison with similar homes in the area
Home Values in the Area
Average Home Value in this Area
Purchase History
| Date | Buyer | Sale Price | Title Company |
|---|---|---|---|
| Jason M And Jessica E Perryman Revocable Livi | -- | None Listed On Document | |
| Perryman Jesscia E | -- | First American Title | |
| Cope Mitchell E | -- | Stewart Title Inc | |
| Cope Mitchell E | -- | Stewart Title |
Source: Public Records
Mortgage History
| Date | Status | Borrower | Loan Amount |
|---|---|---|---|
| Previous Owner | Perryman Jessica E | $312,000 | |
| Previous Owner | Perryman Jesscia E | $284,400 | |
| Previous Owner | Cope Mitchell E | $78,948 | |
| Previous Owner | Cope Mitchell E | $145,000 |
Source: Public Records
Tax History Compared to Growth
Tax History
| Year | Tax Paid | Tax Assessment Tax Assessment Total Assessment is a certain percentage of the fair market value that is determined by local assessors to be the total taxable value of land and additions on the property. | Land | Improvement |
|---|---|---|---|---|
| 2024 | $5,854 | $57,144 | $11,298 | $45,846 |
| 2023 | $5,746 | $55,154 | $11,298 | $43,856 |
| 2022 | $4,950 | $46,713 | $11,298 | $35,415 |
| 2021 | $4,857 | $43,482 | $9,826 | $33,656 |
| 2020 | $4,977 | $44,252 | $8,186 | $36,066 |
| 2019 | $4,918 | $42,803 | $6,547 | $36,256 |
| 2018 | $4,710 | $40,181 | $6,547 | $33,634 |
| 2017 | $4,594 | $38,502 | $5,697 | $32,805 |
| 2016 | $4,339 | $36,340 | $5,697 | $30,643 |
| 2015 | $3,494 | $29,175 | $5,697 | $23,478 |
| 2013 | -- | $26,001 | $5,697 | $20,304 |
Source: Public Records
Map
Nearby Homes
- 9806 W 131st St
- 12730 England St
- 12609 Wedd St
- 13109 Grandview St
- 12552 Farley St
- 13230 Knox St
- 10213 W 126th St
- 13173 England St
- 8913 W 131st St
- 13129 Goddard Ave
- 8900 W 125th Terrace
- 9304 W 124th Terrace
- 12503 Nieman Rd
- 12321 Wedd St
- 12407 England St
- 12314 England St
- 9419 W 122nd St Unit 3
- 12508 Barton St
- 12207 England St
- 13118 Hadley St