Estimated Value: $450,000 - $501,000
3
Beds
3
Baths
3,116
Sq Ft
$151/Sq Ft
Est. Value
About This Home
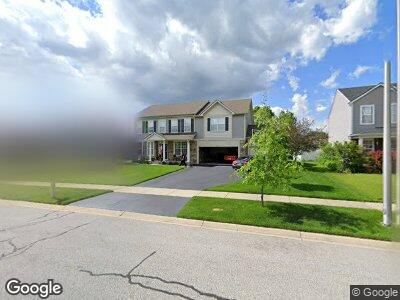
This home is located at 1297 Flagstone Dr, Dyer, IN 46311 and is currently estimated at $469,462, approximately $150 per square foot. 1297 Flagstone Dr is a home located in Lake County with nearby schools including Kahler Middle School, Protsman Elementary School, and Lake Central High School.
Ownership History
Date
Name
Owned For
Owner Type
Purchase Details
Closed on
Dec 29, 2008
Sold by
Oberc Bryan J
Bought by
Oberc Bryan and Oberc Kristen
Current Estimated Value
Purchase Details
Closed on
Feb 15, 2008
Sold by
Oberc Bryan J and Parks Kristen C
Bought by
Oberc Bryan J
Home Financials for this Owner
Home Financials are based on the most recent Mortgage that was taken out on this home.
Original Mortgage
$272,500
Interest Rate
5.75%
Mortgage Type
Stand Alone Refi Refinance Of Original Loan
Purchase Details
Closed on
Aug 6, 2007
Sold by
Hearthstone/Dyer Development Llc
Bought by
Oberc Bryan J and Parks Kristen C
Home Financials for this Owner
Home Financials are based on the most recent Mortgage that was taken out on this home.
Original Mortgage
$268,400
Interest Rate
6.71%
Mortgage Type
Purchase Money Mortgage
Create a Home Valuation Report for This Property
The Home Valuation Report is an in-depth analysis detailing your home's value as well as a comparison with similar homes in the area
Home Values in the Area
Average Home Value in this Area
Purchase History
| Date | Buyer | Sale Price | Title Company |
|---|---|---|---|
| Oberc Bryan | -- | None Available | |
| Oberc Bryan J | -- | Ticor Title Highland | |
| Oberc Bryan J | -- | Ticor So |
Source: Public Records
Mortgage History
| Date | Status | Borrower | Loan Amount |
|---|---|---|---|
| Open | Oberc Kristen | $295,000 | |
| Closed | Oberc Bryan | $228,000 | |
| Closed | Oberc Bryan | $28,500 | |
| Closed | Oberg Bryan | $269,410 | |
| Closed | Oberc Bryan J | $272,500 | |
| Closed | Oberc Bryan J | $268,400 |
Source: Public Records
Tax History Compared to Growth
Tax History
| Year | Tax Paid | Tax Assessment Tax Assessment Total Assessment is a certain percentage of the fair market value that is determined by local assessors to be the total taxable value of land and additions on the property. | Land | Improvement |
|---|---|---|---|---|
| 2024 | $10,394 | $439,600 | $81,600 | $358,000 |
| 2023 | $4,854 | $408,700 | $81,600 | $327,100 |
| 2022 | $4,854 | $396,300 | $81,600 | $314,700 |
| 2021 | $3,988 | $334,200 | $59,500 | $274,700 |
| 2020 | $3,785 | $314,000 | $59,500 | $254,500 |
| 2019 | $3,656 | $292,600 | $56,500 | $236,100 |
| 2018 | $3,594 | $290,400 | $56,500 | $233,900 |
| 2017 | $3,367 | $292,200 | $56,500 | $235,700 |
| 2016 | $3,426 | $292,900 | $56,500 | $236,400 |
| 2014 | $3,225 | $290,600 | $56,500 | $234,100 |
| 2013 | $3,219 | $286,600 | $56,500 | $230,100 |
Source: Public Records
Map
Nearby Homes
- 1370 Deer Creek Dr
- 1933 Northwinds Dr
- 1943 Corinne Dr
- 1081 Flagstone Dr
- 1953 Corinne Dr
- 1437 Schaller Ln
- 1856 Saturday Evening Ave
- 1753 Autumn Ct
- 1426 Schaller Ln
- 1767 Autumn Ct
- 1361 Silver Fern Ln
- 905 Flagstone Dr
- 1211 Joliet St
- 1451 Joliet St
- 1246 Lily Ln
- 802 Manistee Ave
- 1293 Lily Ln
- 1528 Muirfield Dr
- 1321 Lily Ct
- 1594 Joliet St