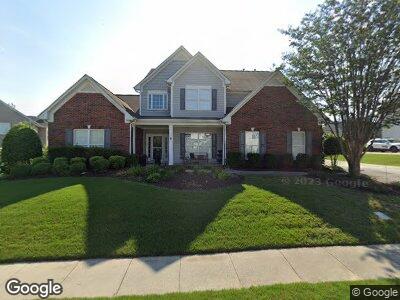
13 Braeburn Dr Simpsonville, SC 29681
Five Forks NeighborhoodEstimated Value: $438,000 - $483,000
4
Beds
4
Baths
2,800
Sq Ft
$162/Sq Ft
Est. Value
About This Home
This home is located at 13 Braeburn Dr, Simpsonville, SC 29681 and is currently estimated at $453,356, approximately $161 per square foot. 13 Braeburn Dr is a home located in Greenville County with nearby schools including Bell's Crossing Elementary School, Riverside Middle School, and Mauldin High.
Ownership History
Date
Name
Owned For
Owner Type
Purchase Details
Closed on
Jun 27, 2014
Sold by
Attaway David C and Attaway Laura B
Bought by
Campbell Robert H and Campbell Ladonna Law
Current Estimated Value
Purchase Details
Closed on
Jun 27, 2013
Sold by
Attaway David C and Attaway Laura B
Bought by
Campbell Robert H and Campbell Ladonna Law
Home Financials for this Owner
Home Financials are based on the most recent Mortgage that was taken out on this home.
Original Mortgage
$212,720
Interest Rate
4.23%
Mortgage Type
New Conventional
Purchase Details
Closed on
Dec 7, 2011
Sold by
Attaway David C and Attaway Laura B
Bought by
Attaway David C and Attaway Laura B
Home Financials for this Owner
Home Financials are based on the most recent Mortgage that was taken out on this home.
Original Mortgage
$213,000
Interest Rate
4.06%
Mortgage Type
New Conventional
Create a Home Valuation Report for This Property
The Home Valuation Report is an in-depth analysis detailing your home's value as well as a comparison with similar homes in the area
Home Values in the Area
Average Home Value in this Area
Purchase History
| Date | Buyer | Sale Price | Title Company |
|---|---|---|---|
| Campbell Robert H | $265,900 | -- | |
| Attaway David C | -- | -- |
Source: Public Records
Mortgage History
| Date | Status | Borrower | Loan Amount |
|---|---|---|---|
| Previous Owner | Campbell Robert H | $212,720 | |
| Previous Owner | Attaway David C | $213,000 | |
| Previous Owner | Attaway David C | $202,900 | |
| Previous Owner | Attaway David C | $38,050 |
Source: Public Records
Tax History Compared to Growth
Tax History
| Year | Tax Paid | Tax Assessment Tax Assessment Total Assessment is a certain percentage of the fair market value that is determined by local assessors to be the total taxable value of land and additions on the property. | Land | Improvement |
|---|---|---|---|---|
| 2024 | $1,334 | $10,760 | $1,600 | $9,160 |
| 2023 | $1,334 | $10,760 | $1,600 | $9,160 |
| 2022 | $1,287 | $10,760 | $1,600 | $9,160 |
| 2021 | $1,267 | $10,760 | $1,600 | $9,160 |
| 2020 | $1,156 | $9,460 | $1,200 | $8,260 |
| 2019 | $1,137 | $9,460 | $1,200 | $8,260 |
| 2018 | $1,217 | $9,460 | $1,200 | $8,260 |
| 2017 | $1,217 | $9,460 | $1,200 | $8,260 |
| 2016 | $1,165 | $236,550 | $30,000 | $206,550 |
| 2015 | $1,455 | $236,550 | $30,000 | $206,550 |
| 2014 | $1,467 | $239,410 | $32,000 | $207,410 |
Source: Public Records
Map
Nearby Homes
- 309 Golden Leaf Ln
- 208 Dunrobin Ln
- 214 Allendale Abbey Ln
- 606 Greening Dr
- 22 S Penobscot Ct
- 509 Grimes Dr
- 303 Adirondack Way
- 115 Innisbrook Ln
- 317 Stayman Ct
- 207 Chestnut Pond Ln
- 202 Chestnut Pond Ln
- 104 Loden Ct
- 126 Chestnut Pond Ln
- 116 Chestnut Pond Ln
- 14 Cog Hill Dr
- 102 Welsford Ct
- 317 Tanoak Ct
- 602 Creekside Bluff Ct
- 309 Nebbiolo Ln
- 104 Bruce Farm Rd