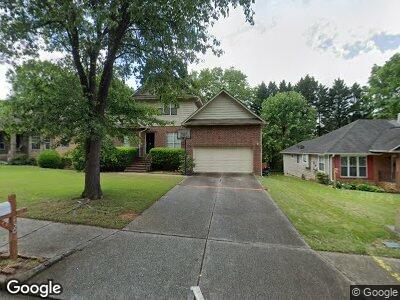
130 Greenmont Cir Alpharetta, GA 30009
Estimated Value: $598,000 - $711,000
4
Beds
3
Baths
2,657
Sq Ft
$243/Sq Ft
Est. Value
About This Home
This home is located at 130 Greenmont Cir, Alpharetta, GA 30009 and is currently estimated at $645,534, approximately $242 per square foot. 130 Greenmont Cir is a home located in Fulton County with nearby schools including Alpharetta Elementary School, Northwestern Middle School, and Milton High School.
Ownership History
Date
Name
Owned For
Owner Type
Purchase Details
Closed on
Sep 5, 2008
Sold by
Taylor Kenneth J and Taylor Kellie M
Bought by
Harjani Kavita
Current Estimated Value
Home Financials for this Owner
Home Financials are based on the most recent Mortgage that was taken out on this home.
Original Mortgage
$195,000
Interest Rate
5.96%
Mortgage Type
New Conventional
Purchase Details
Closed on
Jun 15, 2001
Sold by
Wansley Phillip D and Wansley Amanda A
Bought by
Taylor Kenneth J and Taylor Kellie M
Home Financials for this Owner
Home Financials are based on the most recent Mortgage that was taken out on this home.
Original Mortgage
$184,300
Interest Rate
7.11%
Mortgage Type
New Conventional
Purchase Details
Closed on
Jan 14, 1994
Sold by
Piolax Corp
Bought by
Wansley Philip D Amanda A
Home Financials for this Owner
Home Financials are based on the most recent Mortgage that was taken out on this home.
Original Mortgage
$111,600
Interest Rate
7.1%
Create a Home Valuation Report for This Property
The Home Valuation Report is an in-depth analysis detailing your home's value as well as a comparison with similar homes in the area
Home Values in the Area
Average Home Value in this Area
Purchase History
| Date | Buyer | Sale Price | Title Company |
|---|---|---|---|
| Harjani Kavita | $260,000 | -- | |
| Taylor Kenneth J | $194,000 | -- | |
| Wansley Philip D Amanda A | $124,000 | -- |
Source: Public Records
Mortgage History
| Date | Status | Borrower | Loan Amount |
|---|---|---|---|
| Open | Harjani Kavita A | $236,000 | |
| Closed | Harjani Kavita A | $195,075 | |
| Previous Owner | Harjani Kavita | $195,000 | |
| Previous Owner | Taylor Kenneth J | $53,000 | |
| Previous Owner | Taylor Kenneth J | $172,800 | |
| Previous Owner | Taylor Kenneth J | $20,000 | |
| Previous Owner | Taylor Kenneth J | $184,300 | |
| Previous Owner | Wansley Philip D | $11,094 | |
| Previous Owner | Wansley Philip D Amanda A | $111,600 |
Source: Public Records
Tax History Compared to Growth
Tax History
| Year | Tax Paid | Tax Assessment Tax Assessment Total Assessment is a certain percentage of the fair market value that is determined by local assessors to be the total taxable value of land and additions on the property. | Land | Improvement |
|---|---|---|---|---|
| 2023 | $5,853 | $207,360 | $39,040 | $168,320 |
| 2022 | $2,457 | $186,680 | $28,680 | $158,000 |
| 2021 | $2,813 | $161,920 | $21,520 | $140,400 |
| 2020 | $2,827 | $155,440 | $23,680 | $131,760 |
| 2019 | $382 | $152,680 | $23,280 | $129,400 |
| 2018 | $3,359 | $142,040 | $21,320 | $120,720 |
| 2017 | $2,165 | $86,160 | $14,280 | $71,880 |
| 2016 | $2,164 | $86,160 | $14,280 | $71,880 |
| 2015 | $2,468 | $86,160 | $14,280 | $71,880 |
| 2014 | $2,250 | $86,160 | $14,280 | $71,880 |
Source: Public Records
Map
Nearby Homes
- 1380 Rucker Rd
- 2125 Fairfax Dr
- 1530 Rucker Rd
- 12260 Greenmont Walk
- 120 Arrowood Ln
- 309 Elizabeth Blvd
- 4880 Hunters Oaks Ln Unit 2B
- 201 Saddle Rd
- 3052 Steeplechase
- 3054 Steeplechase
- 1213 Harris Commons Place
- 3042 Steeplechase Unit 2
- 3067 Steeplechase
- 1491 Bellsmith Dr
- 310 Kingspring Ct
- 330 Wagon Way
- 1395 Mid Broadwell Rd