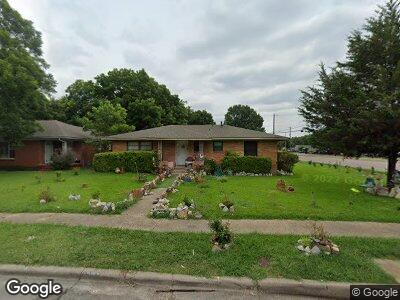
1304 Dell Oak Dr Dallas, TX 75217
Piedmont NeighborhoodEstimated Value: $232,000 - $275,000
3
Beds
2
Baths
2,025
Sq Ft
$125/Sq Ft
Est. Value
About This Home
This home is located at 1304 Dell Oak Dr, Dallas, TX 75217 and is currently estimated at $252,426, approximately $124 per square foot. 1304 Dell Oak Dr is a home located in Dallas County with nearby schools including Sylvia Mendez CREW Leadership Academy, Piedmont G.L.O.B.A.L Academy, and W.W. Samuell High School.
Ownership History
Date
Name
Owned For
Owner Type
Purchase Details
Closed on
Jan 25, 1999
Sold by
Flagstar Bank Fsb
Bought by
Garcia Antonio
Current Estimated Value
Home Financials for this Owner
Home Financials are based on the most recent Mortgage that was taken out on this home.
Original Mortgage
$52,150
Outstanding Balance
$14,755
Interest Rate
6.79%
Estimated Equity
$244,857
Purchase Details
Closed on
Jan 5, 1999
Sold by
Davis Bertrand S
Bought by
Flagstar Bank Fsb
Home Financials for this Owner
Home Financials are based on the most recent Mortgage that was taken out on this home.
Original Mortgage
$52,150
Outstanding Balance
$14,755
Interest Rate
6.79%
Estimated Equity
$244,857
Purchase Details
Closed on
Sep 18, 1995
Sold by
Davis Otis L and Davis Dorothy
Bought by
Davis Bertrand S
Home Financials for this Owner
Home Financials are based on the most recent Mortgage that was taken out on this home.
Original Mortgage
$52,950
Interest Rate
7.88%
Create a Home Valuation Report for This Property
The Home Valuation Report is an in-depth analysis detailing your home's value as well as a comparison with similar homes in the area
Home Values in the Area
Average Home Value in this Area
Purchase History
| Date | Buyer | Sale Price | Title Company |
|---|---|---|---|
| Garcia Antonio | -- | Safeco Land Title | |
| Flagstar Bank Fsb | $58,705 | -- | |
| Davis Bertrand S | -- | -- |
Source: Public Records
Mortgage History
| Date | Status | Borrower | Loan Amount |
|---|---|---|---|
| Open | Garcia Antonio | $52,150 | |
| Previous Owner | Davis Bertrand S | $52,950 | |
| Closed | Garcia Antonio | $7,000 |
Source: Public Records
Tax History Compared to Growth
Tax History
| Year | Tax Paid | Tax Assessment Tax Assessment Total Assessment is a certain percentage of the fair market value that is determined by local assessors to be the total taxable value of land and additions on the property. | Land | Improvement |
|---|---|---|---|---|
| 2023 | $1,538 | $169,630 | $30,000 | $139,630 |
| 2022 | $4,241 | $169,630 | $30,000 | $139,630 |
| 2021 | $3,800 | $144,040 | $25,000 | $119,040 |
| 2020 | $3,908 | $144,040 | $25,000 | $119,040 |
| 2019 | $3,628 | $127,520 | $25,000 | $102,520 |
| 2018 | $3,045 | $111,980 | $14,000 | $97,980 |
| 2017 | $1,874 | $68,930 | $14,000 | $54,930 |
| 2016 | $1,874 | $68,930 | $14,000 | $54,930 |
| 2015 | $1,257 | $68,930 | $14,000 | $54,930 |
| 2014 | $1,257 | $62,380 | $14,000 | $48,380 |
Source: Public Records
Map
Nearby Homes
- 1444 Gillette St
- 1234 Templecliff Dr
- 1558 Gillette Cir
- 1539 Brockham Cir
- 6202 Trinity Creek Dr
- 6221 Sarah Lee Ln
- 6808 Umphress Ct
- 1648 Gillette St
- 6715 Whiteridge Dr
- 766 Bethpage Ave
- 754 Ezekial Ave
- 758 Bethpage Ave
- 746 Ezekial Ave
- 7220 Amy St
- 1539 Yucca Dr
- 746 Ella Ave
- 6921 Tillman St
- 1104 Creekside Dr
- 6937 Tillman St
- 7342 Amy St