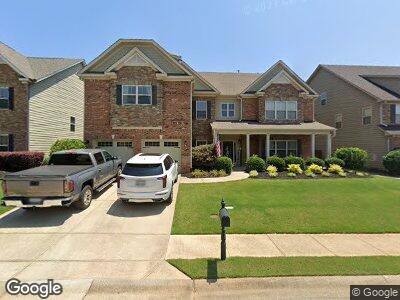
131 Fort Dr Simpsonville, SC 29681
Estimated Value: $646,598 - $716,000
5
Beds
4
Baths
4,200
Sq Ft
$163/Sq Ft
Est. Value
About This Home
This home is located at 131 Fort Dr, Simpsonville, SC 29681 and is currently estimated at $686,400, approximately $163 per square foot. 131 Fort Dr is a home located in Greenville County with nearby schools including Bell's Crossing Elementary School, Riverside Middle School, and Mauldin High.
Ownership History
Date
Name
Owned For
Owner Type
Purchase Details
Closed on
Sep 3, 2013
Sold by
Fisher Lance E
Bought by
Duren Shon J and Duren Rachel P
Current Estimated Value
Home Financials for this Owner
Home Financials are based on the most recent Mortgage that was taken out on this home.
Original Mortgage
$327,750
Interest Rate
4.35%
Mortgage Type
New Conventional
Purchase Details
Closed on
Sep 21, 2012
Sold by
Bk Residential Construction Llc
Bought by
Fisher Lance E
Home Financials for this Owner
Home Financials are based on the most recent Mortgage that was taken out on this home.
Original Mortgage
$288,050
Interest Rate
3.63%
Mortgage Type
New Conventional
Purchase Details
Closed on
Nov 10, 2011
Sold by
Hogan Properties Kilgore Farms Llc
Bought by
Bk Residential Construction Llc
Home Financials for this Owner
Home Financials are based on the most recent Mortgage that was taken out on this home.
Original Mortgage
$249,000
Interest Rate
4.09%
Mortgage Type
New Conventional
Create a Home Valuation Report for This Property
The Home Valuation Report is an in-depth analysis detailing your home's value as well as a comparison with similar homes in the area
Home Values in the Area
Average Home Value in this Area
Purchase History
| Date | Buyer | Sale Price | Title Company |
|---|---|---|---|
| Duren Shon J | $345,000 | -- | |
| Fisher Lance E | $336,550 | -- | |
| Bk Residential Construction Llc | $49,000 | -- |
Source: Public Records
Mortgage History
| Date | Status | Borrower | Loan Amount |
|---|---|---|---|
| Open | Duren Rachel P | $360,500 | |
| Closed | Duren Rachel P | $310,900 | |
| Closed | Duren Rachel P | $323,000 | |
| Previous Owner | Duren Shon J | $327,750 | |
| Previous Owner | Fisher Lance E | $288,050 | |
| Previous Owner | Bk Residential Construction Llc | $249,000 |
Source: Public Records
Tax History Compared to Growth
Tax History
| Year | Tax Paid | Tax Assessment Tax Assessment Total Assessment is a certain percentage of the fair market value that is determined by local assessors to be the total taxable value of land and additions on the property. | Land | Improvement |
|---|---|---|---|---|
| 2024 | $2,308 | $15,290 | $2,400 | $12,890 |
| 2023 | $2,308 | $15,290 | $2,400 | $12,890 |
| 2022 | $2,227 | $15,290 | $2,400 | $12,890 |
| 2021 | $2,192 | $15,290 | $2,400 | $12,890 |
| 2020 | $2,027 | $13,290 | $2,200 | $11,090 |
| 2019 | $1,994 | $13,290 | $2,200 | $11,090 |
| 2018 | $2,103 | $13,290 | $2,200 | $11,090 |
| 2017 | $2,103 | $13,290 | $2,200 | $11,090 |
| 2016 | $2,021 | $332,350 | $55,000 | $277,350 |
| 2015 | $2,024 | $332,350 | $55,000 | $277,350 |
| 2014 | $2,016 | $331,500 | $60,000 | $271,500 |
Source: Public Records
Map
Nearby Homes
- 127 Fort Dr
- 111 Fort Dr
- 232 Raven Falls Ln
- 212 Raven Falls Ln
- 217 Raven Falls Ln
- 2 Quiet Creek Ct
- 23 Copperdale Dr
- 1308 Anderson Ridge Rd
- 204 Isleview Place Unit HCE 36 Adams A
- 202 Isleview Place
- 106 Leaning Oaks Ln Unit HCE 26 Franklin C
- 302 Riverland Way
- 303 Riverland Way Unit HCE 23 Franklin B
- 305 Riverland Way Unit HCE 22 Franklin C
- 11 Garden Corners Ct
- 107 Lori Dr
- 241 Meadow Blossom Way
- 255 Meadow Blossom Way
- 608 Rutland Ct
- 309 Nebbiolo Ln