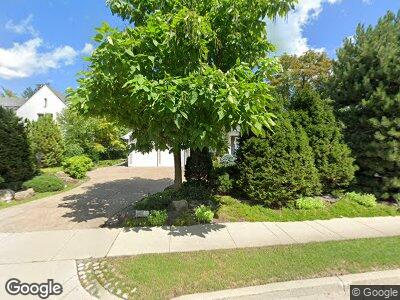
1310 Sheridan Rd Wilmette, IL 60091
Estimated Value: $2,473,000 - $4,264,985
5
Beds
4
Baths
4,663
Sq Ft
$785/Sq Ft
Est. Value
About This Home
This home is located at 1310 Sheridan Rd, Wilmette, IL 60091 and is currently estimated at $3,659,995, approximately $784 per square foot. 1310 Sheridan Rd is a home located in Cook County with nearby schools including Central Elementary School, Highcrest Middle School, and Wilmette Junior High School.
Ownership History
Date
Name
Owned For
Owner Type
Purchase Details
Closed on
Jun 16, 2023
Sold by
Sabow Adam M and Sabow Sue L
Bought by
Adam M Sabow Trust and Sue L Sabow Trust
Current Estimated Value
Purchase Details
Closed on
Jan 6, 2020
Sold by
Baugher Peter V and Baugher Robin S
Bought by
Chicago Title Land Trust Company and Trust Number 8002382489
Home Financials for this Owner
Home Financials are based on the most recent Mortgage that was taken out on this home.
Original Mortgage
$3,060,000
Interest Rate
2.75%
Mortgage Type
New Conventional
Purchase Details
Closed on
Dec 11, 2003
Sold by
Baugher Peter V and Baugher Robin S
Bought by
Baugher Peter V and Baugher Robin S
Create a Home Valuation Report for This Property
The Home Valuation Report is an in-depth analysis detailing your home's value as well as a comparison with similar homes in the area
Home Values in the Area
Average Home Value in this Area
Purchase History
| Date | Buyer | Sale Price | Title Company |
|---|---|---|---|
| Adam M Sabow Trust | -- | None Listed On Document | |
| Chicago Title Land Trust Company | $4,080,000 | Greater Illinois Title | |
| Baugher Peter V | -- | -- |
Source: Public Records
Mortgage History
| Date | Status | Borrower | Loan Amount |
|---|---|---|---|
| Previous Owner | Chicago Title Land Trust Co | $2,800,000 | |
| Previous Owner | Chicago Title Land Trust Company | $3,060,000 | |
| Previous Owner | Baugher Peter | $500,000 | |
| Previous Owner | Baugher Peter | $1,000,000 | |
| Previous Owner | Baugher Peter | $650,000 | |
| Previous Owner | Baugher Peter | $400,000 | |
| Previous Owner | Baugher Peter | $353,000 |
Source: Public Records
Tax History Compared to Growth
Tax History
| Year | Tax Paid | Tax Assessment Tax Assessment Total Assessment is a certain percentage of the fair market value that is determined by local assessors to be the total taxable value of land and additions on the property. | Land | Improvement |
|---|---|---|---|---|
| 2024 | $55,328 | $257,611 | $69,552 | $188,059 |
| 2023 | $55,328 | $257,611 | $69,552 | $188,059 |
| 2022 | $55,328 | $257,611 | $69,552 | $188,059 |
| 2021 | $37,302 | $143,582 | $67,068 | $76,514 |
| 2020 | $36,693 | $143,582 | $67,068 | $76,514 |
| 2019 | $34,194 | $156,068 | $67,068 | $89,000 |
| 2018 | $52,926 | $228,650 | $54,648 | $174,002 |
| 2017 | $63,366 | $280,000 | $54,648 | $225,352 |
| 2016 | $55,583 | $260,000 | $54,648 | $205,352 |
| 2015 | $64,545 | $260,000 | $99,360 | $160,640 |
| 2014 | $62,889 | $260,000 | $99,360 | $160,640 |
| 2013 | $60,046 | $260,000 | $99,360 | $160,640 |
Source: Public Records
Map
Nearby Homes
- 1410 Sheridan Rd Unit 2B
- 727 Ashland Ave
- 1112 Sheridan Rd
- 1500 Sheridan Rd Unit 1G
- 1500 Sheridan Rd Unit 9B
- 832 Forest Ave
- 81 Robsart Rd
- 1630 Sheridan Rd Unit 8K
- 1630 Sheridan Rd Unit 4M
- 1630 Sheridan Rd Unit 5K
- 929 Sheridan Rd
- 701 Lake Ave
- 706 Washington Ave
- 139 Abingdon Ave
- 730 9th St
- 159 Abingdon Ave
- 714 Central Ave
- 1118 Forest Ave
- 111 Oxford Rd
- 1222 Chestnut Ave