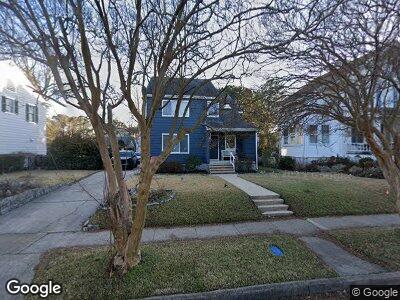
1311 Cornwall Place Norfolk, VA 23508
Larchmont/Edgewater NeighborhoodEstimated Value: $499,545 - $517,000
4
Beds
3
Baths
2,137
Sq Ft
$238/Sq Ft
Est. Value
About This Home
This home is located at 1311 Cornwall Place, Norfolk, VA 23508 and is currently estimated at $507,886, approximately $237 per square foot. 1311 Cornwall Place is a home located in Norfolk City with nearby schools including Larchmont Elementary School, Blair Middle School, and Maury High School.
Ownership History
Date
Name
Owned For
Owner Type
Purchase Details
Closed on
May 5, 2022
Sold by
Whitfield Noah D
Bought by
Sealy Elliot and Sealy Emily
Current Estimated Value
Home Financials for this Owner
Home Financials are based on the most recent Mortgage that was taken out on this home.
Original Mortgage
$454,000
Outstanding Balance
$435,620
Interest Rate
5.27%
Mortgage Type
New Conventional
Estimated Equity
$61,109
Create a Home Valuation Report for This Property
The Home Valuation Report is an in-depth analysis detailing your home's value as well as a comparison with similar homes in the area
Home Values in the Area
Average Home Value in this Area
Purchase History
| Date | Buyer | Sale Price | Title Company |
|---|---|---|---|
| Sealy Elliot | $454,000 | Watson Leslie R |
Source: Public Records
Mortgage History
| Date | Status | Borrower | Loan Amount |
|---|---|---|---|
| Open | Sealy Elliot | $454,000 | |
| Previous Owner | Franklin Lynn E | $227,000 | |
| Previous Owner | Franklin Lynn E | $239,000 | |
| Previous Owner | Franklin Lynn E | $35,000 | |
| Previous Owner | Franklin Lynn E | $193,457 |
Source: Public Records
Tax History Compared to Growth
Tax History
| Year | Tax Paid | Tax Assessment Tax Assessment Total Assessment is a certain percentage of the fair market value that is determined by local assessors to be the total taxable value of land and additions on the property. | Land | Improvement |
|---|---|---|---|---|
| 2024 | $5,334 | $426,700 | $156,500 | $270,200 |
| 2023 | $5,184 | $414,700 | $156,500 | $258,200 |
| 2022 | $5,090 | $407,200 | $149,000 | $258,200 |
| 2021 | $4,819 | $385,500 | $149,000 | $236,500 |
| 2020 | $4,819 | $372,200 | $149,000 | $223,200 |
| 2019 | $4,565 | $365,200 | $142,000 | $223,200 |
| 2018 | $4,471 | $357,700 | $142,000 | $215,700 |
| 2017 | $4,104 | $356,900 | $142,000 | $214,900 |
| 2016 | $3,961 | $328,500 | $135,000 | $193,500 |
| 2015 | $3,778 | $328,500 | $135,000 | $193,500 |
| 2014 | $3,778 | $328,500 | $135,000 | $193,500 |
Source: Public Records
Map
Nearby Homes
- 6012 Upper Brandon Place
- 1340 Magnolia Ave
- 1338 Rockbridge Ave
- 1331 Surrey Crescent
- 1211 Westmoreland Ave
- 6110 Hampton Blvd
- 1234 Richmond Crescent
- 1215 Buckingham Ave
- 1108 Buckingham Ave
- 1217 Richmond Crescent
- 1108 Cambridge Crescent
- 1036 Larchmont Crescent
- 1515 Mclean Ave
- 1024 Larchmont Crescent
- 1217 Manchester Ave
- 1335 Monterey Ave
- 1112 Bedford Ave
- 5430 Powhatan Ave
- 1120 Lexan Ave
- 1051 S Lexan Crescent