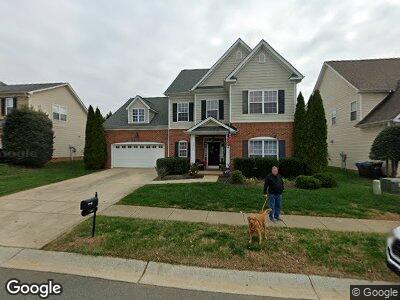
1311 Mallory Ln Waxhaw, NC 28173
Estimated Value: $547,000 - $568,000
4
Beds
3
Baths
2,930
Sq Ft
$190/Sq Ft
Est. Value
About This Home
This home is located at 1311 Mallory Ln, Waxhaw, NC 28173 and is currently estimated at $557,767, approximately $190 per square foot. 1311 Mallory Ln is a home located in Union County with nearby schools including Wesley Chapel Elementary School, Cuthbertson Middle School, and Cuthbertson High School.
Ownership History
Date
Name
Owned For
Owner Type
Purchase Details
Closed on
Apr 7, 2025
Sold by
Bernal Angelique and Lemaster Richard
Bought by
Lemaster Richard and Lemaster Angelique
Current Estimated Value
Home Financials for this Owner
Home Financials are based on the most recent Mortgage that was taken out on this home.
Original Mortgage
$85,000
Outstanding Balance
$85,000
Interest Rate
6.76%
Mortgage Type
Credit Line Revolving
Estimated Equity
$472,767
Purchase Details
Closed on
Apr 11, 2012
Sold by
Lemaster Lisa
Bought by
Lemaster Richard
Purchase Details
Closed on
Aug 24, 2006
Sold by
Lennar Carolinas Llc
Bought by
Lemaster Richard and Lemaster Lisa
Home Financials for this Owner
Home Financials are based on the most recent Mortgage that was taken out on this home.
Original Mortgage
$215,192
Interest Rate
6.67%
Mortgage Type
Unknown
Create a Home Valuation Report for This Property
The Home Valuation Report is an in-depth analysis detailing your home's value as well as a comparison with similar homes in the area
Home Values in the Area
Average Home Value in this Area
Purchase History
| Date | Buyer | Sale Price | Title Company |
|---|---|---|---|
| Lemaster Richard | -- | None Listed On Document | |
| Lemaster Richard | -- | Chicago Title Insurance Co | |
| Lemaster Richard | $269,000 | None Available |
Source: Public Records
Mortgage History
| Date | Status | Borrower | Loan Amount |
|---|---|---|---|
| Open | Lemaster Richard | $85,000 | |
| Previous Owner | Lemaster Richard | $215,192 |
Source: Public Records
Tax History Compared to Growth
Tax History
| Year | Tax Paid | Tax Assessment Tax Assessment Total Assessment is a certain percentage of the fair market value that is determined by local assessors to be the total taxable value of land and additions on the property. | Land | Improvement |
|---|---|---|---|---|
| 2024 | $2,222 | $345,400 | $64,500 | $280,900 |
| 2023 | $2,191 | $345,400 | $64,500 | $280,900 |
| 2022 | $2,191 | $345,400 | $64,500 | $280,900 |
| 2021 | $2,177 | $345,400 | $64,500 | $280,900 |
| 2020 | $2,001 | $259,500 | $48,000 | $211,500 |
| 2019 | $2,040 | $259,500 | $48,000 | $211,500 |
| 2018 | $2,040 | $259,500 | $48,000 | $211,500 |
| 2017 | $2,174 | $259,500 | $48,000 | $211,500 |
| 2016 | $2,102 | $259,500 | $48,000 | $211,500 |
| 2015 | $2,138 | $259,500 | $48,000 | $211,500 |
| 2014 | $1,954 | $280,600 | $70,000 | $210,600 |
Source: Public Records
Map
Nearby Homes
- 1615 Jekyll Ln
- 5301 Greyfriar Ct
- 3011 Kendall Dr Unit 12
- 2007 Kendall Dr Unit 6
- 00 Billy Howey Rd
- 611 Yucatan Dr
- 702 Yucatan Dr
- 900 Springwood Dr
- 6055 Brush Creek
- 5405 Silver Creek Dr
- 2353 Abundance Ln
- 712 Springwood Dr
- 1418 Lonan Dr
- 706 Springwood Dr Unit 14
- 1518 Billy Howey Rd Unit 6
- 724 Cavesson Way
- 1047 Rabbit Hill Ln
- 1102 High Brook Dr
- 1043 Rabbit Hill Ln
- 1000 High Brook Dr