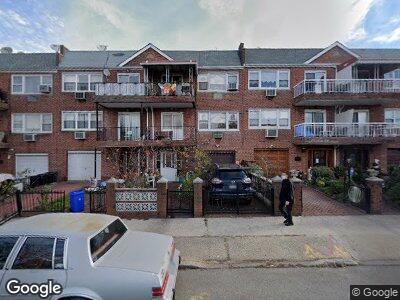
1315 Dahill Rd Brooklyn, NY 11204
Borough Park NeighborhoodEstimated Value: $1,347,000 - $1,689,177
--
Bed
--
Bath
3,328
Sq Ft
$455/Sq Ft
Est. Value
About This Home
This home is located at 1315 Dahill Rd, Brooklyn, NY 11204 and is currently estimated at $1,514,294, approximately $455 per square foot. 1315 Dahill Rd is a home located in Kings County with nearby schools including P.S. 226 Alfred De B. Mason, James Madison High School, and St. Athanasius Catholic Academy.
Ownership History
Date
Name
Owned For
Owner Type
Purchase Details
Closed on
Jun 16, 2021
Sold by
Rosemary Ciofalo Trustee
Bought by
Ciofalo-Gottlieb Lorraine Marie and Gottlieb Louis P
Current Estimated Value
Home Financials for this Owner
Home Financials are based on the most recent Mortgage that was taken out on this home.
Original Mortgage
$412,500
Outstanding Balance
$383,088
Interest Rate
2.9%
Mortgage Type
Purchase Money Mortgage
Estimated Equity
$1,335,688
Purchase Details
Closed on
Dec 21, 2018
Sold by
D'Aversa Cristyn and Lamanna Daniela
Bought by
D'Aversa Cristyn and Lamanna Joseph
Purchase Details
Closed on
Aug 29, 2018
Sold by
D'Aversa Cristyn and Lamanna Daniela
Bought by
D'Aversa Cristyn and Lamanna Daniela
Purchase Details
Closed on
Feb 22, 2018
Sold by
Ciofalo Salvatore A
Bought by
Rosemarie Ciofalo Trustee and Salvatore A Ciofalo 2018 Irrevocable Tr
Create a Home Valuation Report for This Property
The Home Valuation Report is an in-depth analysis detailing your home's value as well as a comparison with similar homes in the area
Home Values in the Area
Average Home Value in this Area
Purchase History
| Date | Buyer | Sale Price | Title Company |
|---|---|---|---|
| Ciofalo-Gottlieb Lorraine Marie | -- | -- | |
| Ciofalo-Gottlieb Lorraine Marie | $550,000 | -- | |
| D'Aversa Cristyn | -- | -- | |
| D'Aversa Cristyn | -- | -- | |
| D'Aversa Cristyn | -- | -- | |
| Rosemarie Ciofalo Trustee | -- | -- |
Source: Public Records
Mortgage History
| Date | Status | Borrower | Loan Amount |
|---|---|---|---|
| Open | Ciofalo-Gottlieb Lorraine Marie | $412,500 |
Source: Public Records
Tax History Compared to Growth
Tax History
| Year | Tax Paid | Tax Assessment Tax Assessment Total Assessment is a certain percentage of the fair market value that is determined by local assessors to be the total taxable value of land and additions on the property. | Land | Improvement |
|---|---|---|---|---|
| 2024 | $11,195 | $90,720 | $23,220 | $67,500 |
| 2023 | $11,077 | $81,360 | $23,220 | $58,140 |
| 2022 | $10,790 | $83,640 | $23,220 | $60,420 |
| 2021 | $4,707 | $89,820 | $23,220 | $66,600 |
| 2020 | $9,318 | $63,420 | $23,220 | $40,200 |
| 2019 | $4,199 | $63,420 | $23,220 | $40,200 |
| 2017 | $8,882 | $45,043 | $18,234 | $26,809 |
| 2016 | $3,626 | $42,494 | $15,843 | $26,651 |
| 2015 | $2,124 | $40,089 | $21,151 | $18,938 |
| 2014 | $2,124 | $38,707 | $19,153 | $19,554 |
Source: Public Records
Map
Nearby Homes
- 2310 60th St
- 2374 60th St
- 6002 24th Ave
- 1440 E 3rd St
- 1441 3rd Ave Unit PHB
- 6214 24 Ave Unit 5A
- 6214 24th Ave Unit 5A
- 1350 E 5th St Unit 1H
- 1350 E 5th St Unit 6L
- 2147 60th St
- 2226 63rd St
- 6314 24th Ave
- 1530 E 2nd St
- 1469 E 5th St
- 2162 62nd St
- 1360 Ocean Pkwy Unit 15D
- 1360 Ocean Pkwy Unit 6M
- 1360 Ocean Pkwy Unit 6N
- 1360 Ocean Pkwy Unit 12H
- 1360 Ocean Pkwy Unit 4L