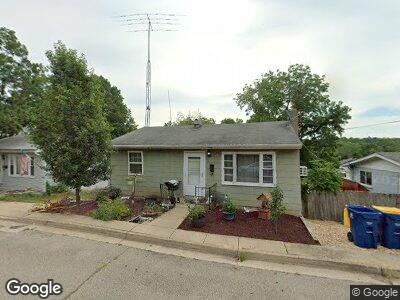
1315 S 3rd St de Soto, MO 63020
Estimated Value: $109,354 - $170,000
--
Bed
1
Bath
832
Sq Ft
$172/Sq Ft
Est. Value
About This Home
This home is located at 1315 S 3rd St, de Soto, MO 63020 and is currently estimated at $143,339, approximately $172 per square foot. 1315 S 3rd St is a home with nearby schools including De Soto Senior High School and St Rose Of Lima School.
Create a Home Valuation Report for This Property
The Home Valuation Report is an in-depth analysis detailing your home's value as well as a comparison with similar homes in the area
Home Values in the Area
Average Home Value in this Area
Tax History Compared to Growth
Tax History
| Year | Tax Paid | Tax Assessment Tax Assessment Total Assessment is a certain percentage of the fair market value that is determined by local assessors to be the total taxable value of land and additions on the property. | Land | Improvement |
|---|---|---|---|---|
| 2023 | $731 | $11,400 | $1,500 | $9,900 |
| 2022 | $730 | $11,400 | $1,500 | $9,900 |
| 2021 | $729 | $11,400 | $1,500 | $9,900 |
| 2020 | $658 | $10,100 | $1,200 | $8,900 |
| 2019 | $658 | $10,100 | $1,200 | $8,900 |
| 2018 | $634 | $10,000 | $1,200 | $8,800 |
| 2017 | $632 | $10,000 | $1,200 | $8,800 |
| 2016 | $586 | $9,100 | $1,300 | $7,800 |
| 2015 | $554 | $9,100 | $1,300 | $7,800 |
| 2013 | $554 | $8,600 | $1,300 | $7,300 |
Source: Public Records
Map
Nearby Homes
- 1112 S 2nd St
- 54 Veterans Dr
- 914 S 3rd St Unit A & B
- 52 Highway E (Veterans Dr ) Hwy
- 53 Highway E (Veterans Dr)
- 621 W Saint Louis St
- 0 Hwy E-Veterans Hwy Unit MAR25014230
- 601 E Main St
- 0 Kennett St
- 100 Kennett St
- 204 S 3rd St
- 207 E 2nd St
- 0 Bogy St Unit MAR24073426
- 113 S 2nd St
- 224 Patricia Lee Dr
- 202 Moulton St
- 4 Easton St
- 104 N 4th St
- 404 Lueking Dr
- 807 Boyd St