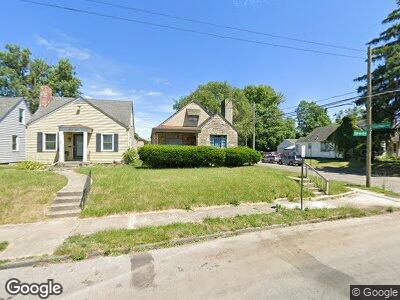
1318 Linwood Ave Columbus, OH 43206
Karn’s Park NeighborhoodEstimated Value: $206,000 - $226,000
3
Beds
2
Baths
1,379
Sq Ft
$155/Sq Ft
Est. Value
About This Home
This home is located at 1318 Linwood Ave, Columbus, OH 43206 and is currently estimated at $213,167, approximately $154 per square foot. 1318 Linwood Ave is a home located in Franklin County with nearby schools including Moler Elementary School, South High School, and Capital Collegiate Preparatory Academy.
Ownership History
Date
Name
Owned For
Owner Type
Purchase Details
Closed on
Jan 10, 2014
Sold by
Marcy John P
Bought by
Marcy Aniko
Current Estimated Value
Purchase Details
Closed on
Jul 8, 2008
Sold by
Wells Fargo Bank Na
Bought by
Marcy John P and Marcy Aniko
Home Financials for this Owner
Home Financials are based on the most recent Mortgage that was taken out on this home.
Original Mortgage
$33,600
Interest Rate
6.57%
Mortgage Type
Purchase Money Mortgage
Purchase Details
Closed on
Jun 18, 2008
Sold by
Sabree Sharon A and Case #07Cve08 10734
Bought by
Wells Fargo Bank Na and Pooling & Servicing Agreement Asset Back
Home Financials for this Owner
Home Financials are based on the most recent Mortgage that was taken out on this home.
Original Mortgage
$33,600
Interest Rate
6.57%
Mortgage Type
Purchase Money Mortgage
Purchase Details
Closed on
Sep 7, 1988
Bought by
Sabree Karim D and Sabree Sharon A
Create a Home Valuation Report for This Property
The Home Valuation Report is an in-depth analysis detailing your home's value as well as a comparison with similar homes in the area
Home Values in the Area
Average Home Value in this Area
Purchase History
| Date | Buyer | Sale Price | Title Company |
|---|---|---|---|
| Marcy Aniko | -- | None Available | |
| Marcy John P | $42,000 | Nova Title Agency Inc | |
| Wells Fargo Bank Na | $46,000 | None Available | |
| Sabree Karim D | $57,500 | -- |
Source: Public Records
Mortgage History
| Date | Status | Borrower | Loan Amount |
|---|---|---|---|
| Open | Marcy Aniko | $96,750 | |
| Closed | Marcy Aniko | $50,000 | |
| Closed | Marcy Aniko | $31,600 | |
| Closed | Marcy John P | $33,600 | |
| Previous Owner | Sabree Karim David | $83,300 | |
| Previous Owner | Sabree Karim David | $68,000 | |
| Previous Owner | Sabree Karim David | $52,000 |
Source: Public Records
Tax History Compared to Growth
Tax History
| Year | Tax Paid | Tax Assessment Tax Assessment Total Assessment is a certain percentage of the fair market value that is determined by local assessors to be the total taxable value of land and additions on the property. | Land | Improvement |
|---|---|---|---|---|
| 2024 | $3,046 | $66,470 | $22,580 | $43,890 |
| 2023 | $3,008 | $66,465 | $22,575 | $43,890 |
| 2022 | $1,428 | $26,880 | $5,460 | $21,420 |
| 2021 | $1,431 | $26,880 | $5,460 | $21,420 |
| 2020 | $1,433 | $26,880 | $5,460 | $21,420 |
| 2019 | $1,260 | $20,270 | $4,200 | $16,070 |
| 2018 | $1,460 | $20,270 | $4,200 | $16,070 |
| 2017 | $1,260 | $20,270 | $4,200 | $16,070 |
| 2016 | $1,664 | $24,500 | $3,710 | $20,790 |
| 2015 | $1,515 | $24,500 | $3,710 | $20,790 |
| 2014 | $1,519 | $24,500 | $3,710 | $20,790 |
| 2013 | $789 | $25,795 | $3,920 | $21,875 |
Source: Public Records
Map
Nearby Homes
- 1321 Studer Ave Unit 1319
- 1282-1284 Linwood Ave
- 1343 Miller Ave
- 1457 Lockbourne Rd
- 1324 Oakwood Ave
- 1418-1422 Miller Ave
- 1185 Studer Ave
- 1479 Lockbourne Rd
- 1366 Oakwood Ave
- 1217 Oakwood Ave
- 1284-1286 S Champion Ave
- 1381 Oakwood Ave
- 1170-1172 Oakwood Ave
- 1269 S Champion Ave
- 1405 Lilley Ave
- 1209 S Champion Ave
- 1103 E Whittier St
- 1038 Reinhard Ave
- 1395 S Champion Ave
- 1144 E Whittier St