1321 York Dr Carpentersville, IL 60110
Dundee NeighborhoodEstimated Value: $327,712 - $402,000
3
Beds
--
Bath
2,220
Sq Ft
$166/Sq Ft
Est. Value
About This Home
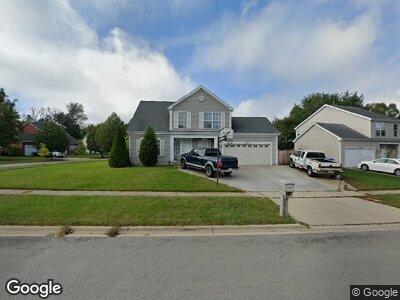
This home is located at 1321 York Dr, Carpentersville, IL 60110 and is currently estimated at $369,178, approximately $166 per square foot. 1321 York Dr is a home located in Kane County with nearby schools including Sunny Hill Elementary School, Barrington Middle School Station Campus, and Barrington High School.
Ownership History
Date
Name
Owned For
Owner Type
Purchase Details
Closed on
Sep 15, 2005
Sold by
Belluomini Americo and Swart Amy A
Bought by
Mejia Manuel and Mejia Rosalinda
Current Estimated Value
Home Financials for this Owner
Home Financials are based on the most recent Mortgage that was taken out on this home.
Original Mortgage
$252,225
Interest Rate
5.93%
Mortgage Type
Purchase Money Mortgage
Purchase Details
Closed on
May 22, 2001
Sold by
Wilson Mills Elizabeth and Wilson Elizabeth A
Bought by
Belluomini Americo and Swart Amy A
Home Financials for this Owner
Home Financials are based on the most recent Mortgage that was taken out on this home.
Original Mortgage
$170,100
Interest Rate
7.16%
Purchase Details
Closed on
Jul 6, 1995
Sold by
Kennedy Group Ltd Partnership
Bought by
Wilson Elizabeth A
Home Financials for this Owner
Home Financials are based on the most recent Mortgage that was taken out on this home.
Original Mortgage
$152,500
Interest Rate
7.59%
Create a Home Valuation Report for This Property
The Home Valuation Report is an in-depth analysis detailing your home's value as well as a comparison with similar homes in the area
Home Values in the Area
Average Home Value in this Area
Purchase History
| Date | Buyer | Sale Price | Title Company |
|---|---|---|---|
| Mejia Manuel | $265,500 | Burnet Title Llc | |
| Belluomini Americo | $189,000 | Stewart Title Company | |
| Wilson Elizabeth A | $174,500 | Chicago Title Insurance Co |
Source: Public Records
Mortgage History
| Date | Status | Borrower | Loan Amount |
|---|---|---|---|
| Previous Owner | Mejia Manuel | $252,225 | |
| Previous Owner | Belluomini Americo | $170,000 | |
| Previous Owner | Belluomini Americo | $170,100 | |
| Previous Owner | Wilson Elizabeth A | $152,500 |
Source: Public Records
Tax History Compared to Growth
Tax History
| Year | Tax Paid | Tax Assessment Tax Assessment Total Assessment is a certain percentage of the fair market value that is determined by local assessors to be the total taxable value of land and additions on the property. | Land | Improvement |
|---|---|---|---|---|
| 2023 | $7,623 | $99,568 | $22,465 | $77,103 |
| 2022 | $7,818 | $96,458 | $22,465 | $73,993 |
| 2021 | $7,519 | $91,075 | $21,211 | $69,864 |
| 2020 | $7,145 | $89,027 | $20,734 | $68,293 |
| 2019 | $6,749 | $84,514 | $19,683 | $64,831 |
| 2018 | $6,344 | $76,896 | $19,293 | $57,603 |
| 2017 | $5,898 | $71,933 | $18,048 | $53,885 |
| 2016 | $5,428 | $63,725 | $17,475 | $46,250 |
| 2015 | -- | $56,387 | $19,724 | $36,663 |
| 2014 | -- | $54,830 | $19,179 | $35,651 |
| 2013 | -- | $56,508 | $19,766 | $36,742 |
Source: Public Records
Map
Nearby Homes
- 1816 Cambridge Dr
- 1416 Keele Dr
- 323 Delaware St
- 2134 Aberdeen Dr
- 1409 Indian Ln
- 38 Thrush Rd
- 2123 Tepee Ave
- 0 Illinois 25
- 1414 Kings Rd
- 102 Caddy Ave
- 120 Madera Cir
- 121 San Juan Rd
- 225 Westfield Way
- 703 Houston Dr
- 12 Autumn Trail
- 728 Houston Dr
- 128 Adobe Cir
- 144 Algonquin Rd
- 181 Skyline Dr
- 169 Pheasant Trail