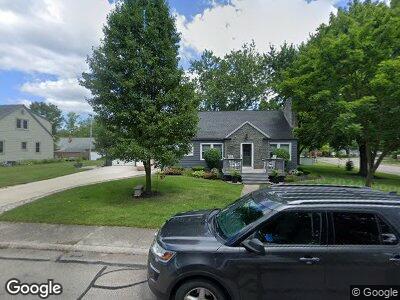
133 Porter Vista Decatur, IN 46733
Stratton Place NeighborhoodEstimated Value: $187,025 - $228,000
3
Beds
1
Bath
3,350
Sq Ft
$63/Sq Ft
Est. Value
About This Home
This home is located at 133 Porter Vista, Decatur, IN 46733 and is currently estimated at $211,006, approximately $62 per square foot. 133 Porter Vista is a home located in Adams County with nearby schools including Bellmont Elementary School, Southeast Elementary School, and Bellmont Middle School.
Ownership History
Date
Name
Owned For
Owner Type
Purchase Details
Closed on
Nov 24, 2010
Sold by
Loshe Jaime N
Bought by
Zimmerman Evan T
Current Estimated Value
Home Financials for this Owner
Home Financials are based on the most recent Mortgage that was taken out on this home.
Original Mortgage
$94,970
Interest Rate
4.75%
Mortgage Type
FHA
Purchase Details
Closed on
Oct 14, 2009
Sold by
Saalfrank Adam R
Bought by
Loshe Jaime N
Purchase Details
Closed on
Apr 30, 2007
Sold by
Jackson Alphonso
Bought by
Loshe Jaime N and Saalfrank Adam R
Home Financials for this Owner
Home Financials are based on the most recent Mortgage that was taken out on this home.
Original Mortgage
$72,000
Interest Rate
6.2%
Mortgage Type
New Conventional
Purchase Details
Closed on
Oct 17, 2006
Sold by
Dubach John W
Bought by
Abn Amro Mortgage Group Inc
Purchase Details
Closed on
Sep 1, 2006
Sold by
Abn Amro Mortgage Group Inc
Bought by
The Secretary Of Hud
Create a Home Valuation Report for This Property
The Home Valuation Report is an in-depth analysis detailing your home's value as well as a comparison with similar homes in the area
Home Values in the Area
Average Home Value in this Area
Purchase History
| Date | Buyer | Sale Price | Title Company |
|---|---|---|---|
| Zimmerman Evan T | -- | -- | |
| Loshe Jaime N | -- | -- | |
| Loshe Jaime N | -- | -- | |
| Abn Amro Mortgage Group Inc | -- | -- | |
| The Secretary Of Hud | -- | -- |
Source: Public Records
Mortgage History
| Date | Status | Borrower | Loan Amount |
|---|---|---|---|
| Open | Zimmerman Evan T | $105,214 | |
| Previous Owner | Zimmerman Evan T | $94,970 | |
| Previous Owner | Loshe Jaime N | $86,500 | |
| Previous Owner | Loshe Jaime N | $89,000 | |
| Previous Owner | Loshe Jaime N | $72,000 |
Source: Public Records
Tax History Compared to Growth
Tax History
| Year | Tax Paid | Tax Assessment Tax Assessment Total Assessment is a certain percentage of the fair market value that is determined by local assessors to be the total taxable value of land and additions on the property. | Land | Improvement |
|---|---|---|---|---|
| 2024 | $1,486 | $148,600 | $23,600 | $125,000 |
| 2023 | $1,375 | $136,900 | $23,600 | $113,300 |
| 2022 | $1,301 | $130,400 | $23,600 | $106,800 |
| 2021 | $1,204 | $120,700 | $22,700 | $98,000 |
| 2020 | $1,021 | $113,900 | $22,700 | $91,200 |
| 2019 | $954 | $112,300 | $22,700 | $89,600 |
| 2018 | $964 | $109,800 | $22,700 | $87,100 |
| 2017 | $959 | $110,200 | $21,700 | $88,500 |
| 2016 | $942 | $111,700 | $21,700 | $90,000 |
| 2014 | $816 | $107,800 | $21,700 | $86,100 |
| 2013 | $982 | $107,100 | $21,700 | $85,400 |
Source: Public Records
Map
Nearby Homes
- 403 Madison St
- 340 Stevenson St
- 604 Short St
- 1019 Palmer's Pass
- 714 Poplar Pass
- 738 Poplar Pass
- 957 Parkview Dr
- 804 Nuttman Ave
- 314 N 9th St
- 239 Briarwood Trail
- 1841 E Bellmont Rd
- 710 Schirmeyer St
- 521 Penn St
- 709 Schirmeyer St
- 112 E Lake Ct
- 927 Schirmeyer St
- 0 N 13th St
- 1224 E Edge Water Ct
- 121 Berkley Ct
- 1266 Oak Grove Place