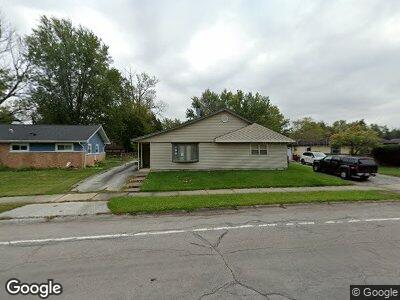
133 Shabbona Dr Park Forest, IL 60466
Estimated Value: $148,000 - $211,000
3
Beds
1
Bath
1,462
Sq Ft
$126/Sq Ft
Est. Value
About This Home
This home is located at 133 Shabbona Dr, Park Forest, IL 60466 and is currently estimated at $183,961, approximately $125 per square foot. 133 Shabbona Dr is a home located in Will County with nearby schools including Talala Elementary School, Crete-Monee Middle School, and Crete-Monee High School.
Ownership History
Date
Name
Owned For
Owner Type
Purchase Details
Closed on
Dec 21, 2020
Sold by
133 Shabbona Llc
Bought by
Johnson Felisha
Current Estimated Value
Home Financials for this Owner
Home Financials are based on the most recent Mortgage that was taken out on this home.
Original Mortgage
$122,735
Outstanding Balance
$111,718
Interest Rate
3.25%
Mortgage Type
FHA
Estimated Equity
$72,746
Purchase Details
Closed on
Jun 12, 2018
Sold by
U S Bank National Assn
Bought by
133 Shabbona Llc
Purchase Details
Closed on
Mar 20, 2018
Sold by
Burton John and Secretary Of Housign And Urban
Bought by
Us Bank Na
Purchase Details
Closed on
May 11, 2011
Sold by
Florey Scott M and Johnson Randal C
Bought by
Burton John
Purchase Details
Closed on
Sep 9, 1994
Sold by
Florey Scott M
Bought by
Florey Scott M and Johnson Randal C
Create a Home Valuation Report for This Property
The Home Valuation Report is an in-depth analysis detailing your home's value as well as a comparison with similar homes in the area
Home Values in the Area
Average Home Value in this Area
Purchase History
| Date | Buyer | Sale Price | Title Company |
|---|---|---|---|
| Johnson Felisha | $125,000 | Chicago Title Insurance Co | |
| 133 Shabbona Llc | $45,000 | Ginali Associates Pc | |
| Us Bank Na | -- | Attorney | |
| Burton John | $95,000 | Chicago Title Insurance Co | |
| Florey Scott M | -- | -- |
Source: Public Records
Mortgage History
| Date | Status | Borrower | Loan Amount |
|---|---|---|---|
| Open | Johnson Felisha | $7,851 | |
| Open | Johnson Felisha | $22,347 | |
| Open | Johnson Felisha | $122,735 | |
| Previous Owner | Burton John | $26,256 | |
| Previous Owner | Burton John | $92,591 | |
| Previous Owner | Burton John | $2,850 | |
| Previous Owner | Florey Scott M | $40,000 | |
| Previous Owner | Florey Scott M | $42,550 |
Source: Public Records
Tax History Compared to Growth
Tax History
| Year | Tax Paid | Tax Assessment Tax Assessment Total Assessment is a certain percentage of the fair market value that is determined by local assessors to be the total taxable value of land and additions on the property. | Land | Improvement |
|---|---|---|---|---|
| 2023 | $6,069 | $39,485 | $8,208 | $31,277 |
| 2022 | $6,069 | $34,733 | $7,220 | $27,513 |
| 2021 | $6,305 | $31,650 | $6,631 | $25,019 |
| 2020 | $6,505 | $30,624 | $6,416 | $24,208 |
| 2019 | $6,571 | $29,041 | $6,084 | $22,957 |
| 2018 | $6,671 | $28,622 | $5,969 | $22,653 |
| 2017 | $5,222 | $29,012 | $5,865 | $23,147 |
| 2016 | $4,898 | $27,731 | $5,631 | $22,100 |
| 2015 | $4,382 | $26,243 | $5,423 | $20,820 |
| 2014 | $4,382 | $25,881 | $5,348 | $20,533 |
| 2013 | $4,382 | $27,100 | $5,600 | $21,500 |
Source: Public Records