Estimated Value: $178,000 - $204,000
3
Beds
1
Bath
1,062
Sq Ft
$180/Sq Ft
Est. Value
About This Home
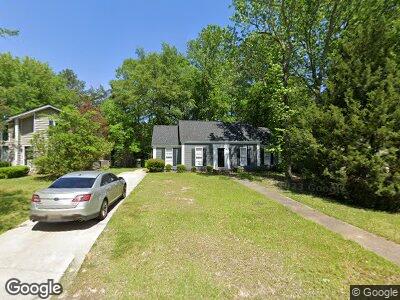
This home is located at 1337 Chadford Rd, Irmo, SC 29063 and is currently estimated at $191,407, approximately $180 per square foot. 1337 Chadford Rd is a home located in Richland County with nearby schools including H. E. Corley Elementary School, Dutch Fork Middle School, and Dutch Fork High School.
Ownership History
Date
Name
Owned For
Owner Type
Purchase Details
Closed on
Sep 1, 2023
Sold by
Vancamp Gabrielle L
Bought by
Gibson Patsy L
Current Estimated Value
Home Financials for this Owner
Home Financials are based on the most recent Mortgage that was taken out on this home.
Original Mortgage
$180,500
Outstanding Balance
$177,909
Interest Rate
7.09%
Mortgage Type
New Conventional
Estimated Equity
-$3,671
Purchase Details
Closed on
Sep 23, 2022
Sold by
Isw Holdings Llc
Bought by
Vancamp Gabrielle L
Home Financials for this Owner
Home Financials are based on the most recent Mortgage that was taken out on this home.
Original Mortgage
$171,830
Interest Rate
5.22%
Mortgage Type
New Conventional
Purchase Details
Closed on
Jan 29, 2002
Sold by
Gasque Michael
Bought by
Gasque Patricia A
Home Financials for this Owner
Home Financials are based on the most recent Mortgage that was taken out on this home.
Original Mortgage
$78,000
Interest Rate
7.16%
Create a Home Valuation Report for This Property
The Home Valuation Report is an in-depth analysis detailing your home's value as well as a comparison with similar homes in the area
Home Values in the Area
Average Home Value in this Area
Purchase History
| Date | Buyer | Sale Price | Title Company |
|---|---|---|---|
| Gibson Patsy L | $190,000 | None Listed On Document | |
| Vancamp Gabrielle L | $175,000 | -- | |
| Gasque Patricia A | -- | -- |
Source: Public Records
Mortgage History
| Date | Status | Borrower | Loan Amount |
|---|---|---|---|
| Open | Gibson Patsy L | $180,500 | |
| Previous Owner | Vancamp Gabrielle L | $171,830 | |
| Previous Owner | Gasque Patricia A | $71,733 | |
| Previous Owner | Gasque Patricia A | $78,000 |
Source: Public Records
Tax History Compared to Growth
Tax History
| Year | Tax Paid | Tax Assessment Tax Assessment Total Assessment is a certain percentage of the fair market value that is determined by local assessors to be the total taxable value of land and additions on the property. | Land | Improvement |
|---|---|---|---|---|
| 2023 | $1,290 | $2,892 | $0 | $0 |
| 2022 | $780 | $72,300 | $18,100 | $54,200 |
| 2021 | $2,167 | $4,340 | $0 | $0 |
| 2020 | $2,177 | $4,340 | $0 | $0 |
| 2019 | $2,234 | $4,340 | $0 | $0 |
| 2018 | $1,867 | $3,770 | $0 | $0 |
| 2017 | $1,808 | $3,770 | $0 | $0 |
| 2016 | $1,762 | $3,770 | $0 | $0 |
| 2015 | $1,761 | $3,770 | $0 | $0 |
| 2014 | $572 | $62,900 | $0 | $0 |
| 2013 | -- | $2,520 | $0 | $0 |
Source: Public Records
Map
Nearby Homes
- 155 Minehead Rd
- 149 Twisted Hill Rd
- 930 Chadford Rd
- 113 W Royal Tower Dr
- 205 Dyers Hall Rd
- 504 Kenton Dr
- 136 Milway Rd
- E/S Farming Creek Rd
- 1307 Farming Creek Rd
- 734 Green Branch Ct
- 1302 Leamington Cir
- 548 Kenton Dr
- 17 Rainbows End Ct
- 10201 Broad River Rd
- 2 Sagefire Ct
- 137 Chapelwhite Rd
- 508 Compass Rose Way
- 212 Shawn Ct
- 416 London Pride Rd
- 131 Garden Brooke Dr