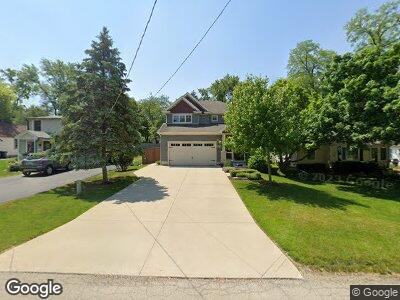
134 W 3rd Ave New Lenox, IL 60451
Estimated Value: $381,000 - $457,000
--
Bed
--
Bath
--
Sq Ft
7,405
Sq Ft Lot
About This Home
This home is located at 134 W 3rd Ave, New Lenox, IL 60451 and is currently estimated at $417,392. 134 W 3rd Ave is a home located in Will County with nearby schools including Bentley Elementary School, Arnold J Tyler School, and Alex M Martino Jr High School.
Ownership History
Date
Name
Owned For
Owner Type
Purchase Details
Closed on
Jun 18, 2018
Sold by
Wieringa Ross J and Wieringa Camille G
Bought by
Mudge Matthew R and Mudge Rebecca I
Current Estimated Value
Home Financials for this Owner
Home Financials are based on the most recent Mortgage that was taken out on this home.
Original Mortgage
$297,000
Outstanding Balance
$188,131
Interest Rate
4%
Mortgage Type
New Conventional
Estimated Equity
$205,548
Purchase Details
Closed on
Feb 20, 2014
Sold by
Pilon Brian D and Pilon Carrie K
Bought by
Wieringa Ross J
Purchase Details
Closed on
Dec 27, 2007
Sold by
Pilon Brian D
Bought by
Pilon Brian D and Pilon Carrie K
Home Financials for this Owner
Home Financials are based on the most recent Mortgage that was taken out on this home.
Original Mortgage
$193,750
Interest Rate
6.27%
Mortgage Type
Stand Alone Refi Refinance Of Original Loan
Create a Home Valuation Report for This Property
The Home Valuation Report is an in-depth analysis detailing your home's value as well as a comparison with similar homes in the area
Home Values in the Area
Average Home Value in this Area
Purchase History
| Date | Buyer | Sale Price | Title Company |
|---|---|---|---|
| Mudge Matthew R | $330,000 | Attorney | |
| Wieringa Ross J | $35,000 | None Available | |
| Pilon Brian D | -- | None Available |
Source: Public Records
Mortgage History
| Date | Status | Borrower | Loan Amount |
|---|---|---|---|
| Open | Mudge Matthew R | $297,000 | |
| Previous Owner | Wieringa Ross J | $140,000 | |
| Previous Owner | Pilon Brian D | $180,000 | |
| Previous Owner | Pilon Brian D | $193,750 |
Source: Public Records
Tax History Compared to Growth
Tax History
| Year | Tax Paid | Tax Assessment Tax Assessment Total Assessment is a certain percentage of the fair market value that is determined by local assessors to be the total taxable value of land and additions on the property. | Land | Improvement |
|---|---|---|---|---|
| 2023 | $8,790 | $110,184 | $19,143 | $91,041 |
| 2022 | $8,264 | $101,505 | $17,635 | $83,870 |
| 2021 | $7,841 | $95,462 | $16,585 | $78,877 |
| 2020 | $7,615 | $92,056 | $15,993 | $76,063 |
| 2019 | $7,286 | $89,201 | $15,497 | $73,704 |
| 2018 | $7,115 | $86,126 | $14,963 | $71,163 |
| 2017 | $6,759 | $83,650 | $14,533 | $69,117 |
| 2016 | $6,559 | $81,411 | $14,144 | $67,267 |
| 2015 | $1,195 | $13,699 | $13,699 | $0 |
| 2014 | $1,195 | $13,530 | $13,530 | $0 |
| 2013 | $1,195 | $13,712 | $13,712 | $0 |
Source: Public Records
Map
Nearby Homes
- 231 Central Rd
- 00 NE Corner Cherry Hill Road and Moss Lane Rd
- 112 E 2nd Ave
- 115 S Cedar Rd
- 116 Hickory St
- 299 E 4th Ave
- 115 E Woodlawn Rd Unit 1
- 501 Beech Ln
- 420 Manor Ct
- 121 Foxhill Ct Unit D
- 828 S Cedar Rd
- 625 Crescenzo Ct Unit A
- 309 Arbor Hill Ct Unit 3
- 210 Roberts Rd
- 216 Ash St
- 115 Fir St
- 242 Hampshire Ct
- 977 Penrith Ln
- 889 Bridle Hill Dr
- 889 Bridle Hill Dr