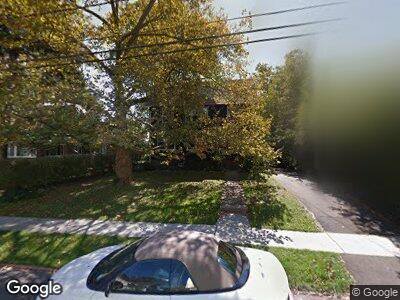
135 W 6th Ave Roselle, NJ 07203
Estimated Value: $636,000 - $723,000
5
Beds
2
Baths
1,999
Sq Ft
$339/Sq Ft
Est. Value
About This Home
This home is located at 135 W 6th Ave, Roselle, NJ 07203 and is currently estimated at $676,875, approximately $338 per square foot. 135 W 6th Ave is a home located in Union County with nearby schools including Washington Elementary School, Leonard V. Moore Middle School, and Grace Wilday Junior High School.
Ownership History
Date
Name
Owned For
Owner Type
Purchase Details
Closed on
Aug 8, 2008
Sold by
Bass Sefton and Bass Celine Santiago
Bought by
Thomas Barca Anthony Della and Thomas Daniel
Current Estimated Value
Home Financials for this Owner
Home Financials are based on the most recent Mortgage that was taken out on this home.
Original Mortgage
$264,000
Interest Rate
6.54%
Mortgage Type
Purchase Money Mortgage
Purchase Details
Closed on
Aug 13, 2001
Sold by
Bass Sefton and Bass Celine
Bought by
Bass Sefton and Bass Celine
Purchase Details
Closed on
Nov 30, 1998
Sold by
Wenneis Jane S and Storms Helen G
Bought by
Bass Sefton and Bass Celine
Home Financials for this Owner
Home Financials are based on the most recent Mortgage that was taken out on this home.
Original Mortgage
$127,900
Interest Rate
6.8%
Mortgage Type
FHA
Create a Home Valuation Report for This Property
The Home Valuation Report is an in-depth analysis detailing your home's value as well as a comparison with similar homes in the area
Home Values in the Area
Average Home Value in this Area
Purchase History
| Date | Buyer | Sale Price | Title Company |
|---|---|---|---|
| Thomas Barca Anthony Della | $330,000 | New Jersey Title Ins Co | |
| Bass Sefton | -- | -- | |
| Bass Sefton | $130,000 | -- |
Source: Public Records
Mortgage History
| Date | Status | Borrower | Loan Amount |
|---|---|---|---|
| Open | Delrosario Estefani | $301,720 | |
| Closed | Barca Anthony Della | $240,000 | |
| Closed | Dellabarca Anthony | $266,400 | |
| Previous Owner | Thomas Barca Anthony Della | $264,000 | |
| Previous Owner | Bass Sefton | $116,000 | |
| Previous Owner | Bass Sefton | $25,000 | |
| Previous Owner | Bass Sefton | $127,900 |
Source: Public Records
Tax History Compared to Growth
Tax History
| Year | Tax Paid | Tax Assessment Tax Assessment Total Assessment is a certain percentage of the fair market value that is determined by local assessors to be the total taxable value of land and additions on the property. | Land | Improvement |
|---|---|---|---|---|
| 2024 | $13,589 | $160,300 | $67,200 | $93,100 |
| 2023 | $13,589 | $160,300 | $67,200 | $93,100 |
| 2022 | $13,683 | $160,300 | $67,200 | $93,100 |
| 2021 | $10,861 | $128,000 | $67,200 | $60,800 |
| 2020 | $10,826 | $128,000 | $67,200 | $60,800 |
| 2019 | $10,688 | $128,000 | $67,200 | $60,800 |
| 2018 | $10,629 | $128,000 | $67,200 | $60,800 |
| 2017 | $10,573 | $128,000 | $67,200 | $60,800 |
| 2016 | $10,340 | $128,000 | $67,200 | $60,800 |
| 2015 | $10,339 | $128,000 | $67,200 | $60,800 |
| 2014 | $10,051 | $128,000 | $67,200 | $60,800 |
Source: Public Records
Map
Nearby Homes