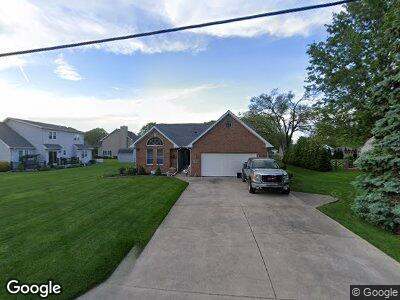
1350 Cherry St Millbury, OH 43447
Estimated Value: $237,701 - $265,000
3
Beds
2
Baths
1,644
Sq Ft
$151/Sq Ft
Est. Value
About This Home
This home is located at 1350 Cherry St, Millbury, OH 43447 and is currently estimated at $248,425, approximately $151 per square foot. 1350 Cherry St is a home located in Wood County with nearby schools including Lake Elementary School, Lake Middle School, and Lake High School.
Ownership History
Date
Name
Owned For
Owner Type
Purchase Details
Closed on
Sep 20, 2023
Sold by
Roberts Jeannie and Roberts Daniel
Bought by
Roberts Daniel and Roberts Jeannie
Current Estimated Value
Purchase Details
Closed on
Aug 12, 2014
Sold by
Kern Anthony T and Kern Cathleen M
Bought by
Roberts Daniel and Roberts Jeannie
Purchase Details
Closed on
Nov 6, 1998
Sold by
Brossia James E and Brossia Barbara R
Bought by
Kern Anthony T and Kern Cathleen M
Home Financials for this Owner
Home Financials are based on the most recent Mortgage that was taken out on this home.
Original Mortgage
$150,350
Interest Rate
6.72%
Mortgage Type
VA
Purchase Details
Closed on
Aug 11, 1988
Bought by
Brossia James E
Create a Home Valuation Report for This Property
The Home Valuation Report is an in-depth analysis detailing your home's value as well as a comparison with similar homes in the area
Home Values in the Area
Average Home Value in this Area
Purchase History
| Date | Buyer | Sale Price | Title Company |
|---|---|---|---|
| Roberts Daniel | -- | None Listed On Document | |
| Roberts Daniel | $157,000 | Port Lawrence Title & Trust | |
| Kern Anthony T | $146,000 | Louisville Title | |
| Brossia James E | $8,000 | -- |
Source: Public Records
Mortgage History
| Date | Status | Borrower | Loan Amount |
|---|---|---|---|
| Previous Owner | Kern Anthony T | $43,101 | |
| Previous Owner | Kern Anthony T | $42,429 | |
| Previous Owner | Kern Anthony T | $149,600 | |
| Previous Owner | Kern Anthony T | $16,000 | |
| Previous Owner | Kern Anthony T | $13,600 | |
| Previous Owner | Kern Anthony T | $150,350 | |
| Previous Owner | Brossia James E | $195,000 |
Source: Public Records
Tax History Compared to Growth
Tax History
| Year | Tax Paid | Tax Assessment Tax Assessment Total Assessment is a certain percentage of the fair market value that is determined by local assessors to be the total taxable value of land and additions on the property. | Land | Improvement |
|---|---|---|---|---|
| 2023 | $2,592 | $65,700 | $9,870 | $55,830 |
| 2021 | $2,453 | $54,150 | $8,230 | $45,920 |
| 2020 | $2,419 | $54,150 | $8,230 | $45,920 |
| 2019 | $2,720 | $47,150 | $8,230 | $38,920 |
| 2018 | $2,717 | $47,150 | $8,230 | $38,920 |
| 2017 | $2,686 | $47,150 | $8,230 | $38,920 |
| 2016 | $2,358 | $41,940 | $8,230 | $33,710 |
| 2015 | $2,358 | $41,940 | $8,230 | $33,710 |
| 2014 | $2,484 | $41,940 | $8,230 | $33,710 |
| 2013 | $2,598 | $41,940 | $8,230 | $33,710 |
Source: Public Records
Map
Nearby Homes
- 28543 Hille Dr
- 1341 Penney Ln
- 0 Penney Ln Unit 6123967
- 1539 Circle Dr
- 1535 Circle Dr
- 1455 Circle Dr
- 1526 Circle Dr
- 1520 Circle Dr
- 1513 Circle Dr
- 1486 Circle Dr
- 1509 Circle Dr
- 28972 Main St
- 24074 W Moline Martin Rd
- 29682 Bradner Rd
- 30406 Cedar Valley Dr
- 23430 State Route 51 W
- 3710 Lakepointe Dr Unit 2
- 0 Royer Dr
- 3963 Rockland Rd
- 4512 Williston Rd