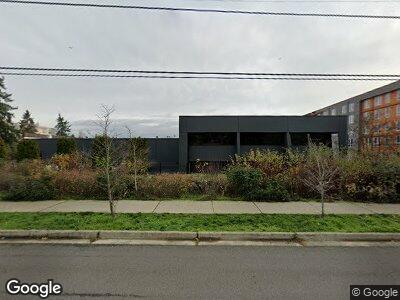
13500 Linden Ave N Seattle, WA 98133
Bitter Lake NeighborhoodEstimated Value: $3,800,068
--
Bed
4
Baths
21,392
Sq Ft
$178/Sq Ft
Est. Value
About This Home
This home is located at 13500 Linden Ave N, Seattle, WA 98133 and is currently estimated at $3,800,068, approximately $177 per square foot. 13500 Linden Ave N is a home located in King County with nearby schools including Broadview-Thomson Elementary School, Robert Eagle Staff Middle School, and Ingraham High School.
Ownership History
Date
Name
Owned For
Owner Type
Purchase Details
Closed on
Apr 12, 2018
Sold by
J W Trosper Llc
Bought by
Overturf Llc
Current Estimated Value
Home Financials for this Owner
Home Financials are based on the most recent Mortgage that was taken out on this home.
Original Mortgage
$1,243,711
Interest Rate
4.43%
Purchase Details
Closed on
Dec 27, 2001
Sold by
Blackbourn Holdings Llc
Bought by
J W Trosper Llc
Home Financials for this Owner
Home Financials are based on the most recent Mortgage that was taken out on this home.
Original Mortgage
$80,000
Interest Rate
6.51%
Purchase Details
Closed on
Oct 11, 2001
Sold by
Blackbourn Ruth V and Blackbourn Ruth V
Bought by
Blackbourn Holdings Llc
Purchase Details
Closed on
Oct 4, 2001
Sold by
Blackbourn Ruth V
Bought by
Blackbourn Ruth and Blackbourn Donald H
Create a Home Valuation Report for This Property
The Home Valuation Report is an in-depth analysis detailing your home's value as well as a comparison with similar homes in the area
Home Values in the Area
Average Home Value in this Area
Purchase History
| Date | Buyer | Sale Price | Title Company |
|---|---|---|---|
| Overturf Llc | $2,888,000 | Fidelity National Title | |
| J W Trosper Llc | $1,600,000 | Pacific Northwest Title | |
| Blackbourn Holdings Llc | -- | -- | |
| Blackbourn Ruth | -- | -- |
Source: Public Records
Mortgage History
| Date | Status | Borrower | Loan Amount |
|---|---|---|---|
| Open | Overturf Llc | $1,000,000 | |
| Closed | Overturf Llc | $1,243,711 | |
| Previous Owner | J W Trosper Llc | $316,000 | |
| Previous Owner | J W Trosper Llc | $250,000 | |
| Previous Owner | J W Trosper Llc | $405,000 | |
| Previous Owner | J W Trosper Llc | $80,000 |
Source: Public Records
Tax History Compared to Growth
Tax History
| Year | Tax Paid | Tax Assessment Tax Assessment Total Assessment is a certain percentage of the fair market value that is determined by local assessors to be the total taxable value of land and additions on the property. | Land | Improvement |
|---|---|---|---|---|
| 2024 | $41,384 | $3,911,100 | $1,625,300 | $2,285,800 |
| 2023 | $29,931 | $3,104,500 | $1,625,300 | $1,479,200 |
| 2022 | $31,875 | $3,104,500 | $1,500,300 | $1,604,200 |
| 2021 | $28,714 | $3,104,500 | $1,500,300 | $1,604,200 |
| 2020 | $26,713 | $2,636,700 | $1,500,300 | $1,136,400 |
| 2018 | $23,089 | $2,473,600 | $1,375,300 | $1,098,300 |
| 2017 | $22,144 | $2,060,700 | $1,125,200 | $935,500 |
| 2016 | $20,902 | $2,060,700 | $1,000,200 | $1,060,500 |
| 2015 | $19,852 | $1,906,000 | $1,000,200 | $905,800 |
| 2014 | -- | $1,867,700 | $1,000,200 | $867,500 |
| 2013 | -- | $1,828,300 | $1,000,200 | $828,100 |
Source: Public Records
Map
Nearby Homes
- 13543 Linden Ave N Unit B-106
- 13229 Linden Ave N Unit 308B
- 13215 Linden Ave N Unit C209
- 13201 Linden Ave N Unit 403A
- 13201 Linden Ave N Unit 408A
- 13201 Linden Ave N Unit 402A
- 13726 Midvale Ave N Unit A
- 1220 N 137th St
- 14012 Midvale Ave N
- 903 N 130th St Unit 302
- 903 N 130th St Unit 301
- 1403 N 137th St
- 707 N 130th St Unit B102
- 322 N 134th St Unit 203
- 300 N 130th St Unit 3206
- 300 N 130th St Unit 4104
- 300 N 130th St Unit 5106
- 300 N 130th St Unit 7104
- 750 N 143rd St Unit 211
- 750 N 143rd St Unit B5