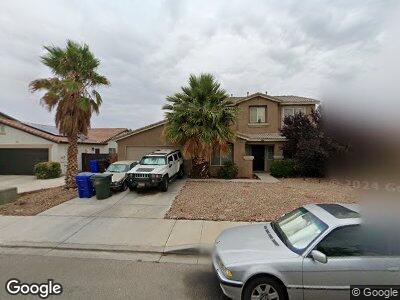
13581 Fox Point Rd Victorville, CA 92392
La Mesa NeighborhoodEstimated Value: $501,522 - $523,000
3
Beds
4
Baths
2,976
Sq Ft
$173/Sq Ft
Est. Value
About This Home
This home is located at 13581 Fox Point Rd, Victorville, CA 92392 and is currently estimated at $513,631, approximately $172 per square foot. 13581 Fox Point Rd is a home located in San Bernardino County with nearby schools including Liberty Elementary School, Park View Elementary School, and Imogene Garner Hook Junior High School.
Ownership History
Date
Name
Owned For
Owner Type
Purchase Details
Closed on
Jan 16, 2021
Sold by
Rogers Frances
Bought by
Mease Richard A
Current Estimated Value
Purchase Details
Closed on
Nov 1, 2019
Sold by
Rogers Cheryl
Bought by
Rogers Frances
Home Financials for this Owner
Home Financials are based on the most recent Mortgage that was taken out on this home.
Original Mortgage
$100,000
Interest Rate
3.6%
Mortgage Type
Commercial
Purchase Details
Closed on
Nov 28, 2017
Sold by
Mease Richard A
Bought by
Mease Richard A and Rogers Cheryl E
Purchase Details
Closed on
Oct 23, 2003
Sold by
Mease Cheryl E
Bought by
Mease Richard A
Home Financials for this Owner
Home Financials are based on the most recent Mortgage that was taken out on this home.
Original Mortgage
$242,350
Interest Rate
5.87%
Mortgage Type
Purchase Money Mortgage
Create a Home Valuation Report for This Property
The Home Valuation Report is an in-depth analysis detailing your home's value as well as a comparison with similar homes in the area
Home Values in the Area
Average Home Value in this Area
Purchase History
| Date | Buyer | Sale Price | Title Company |
|---|---|---|---|
| Mease Richard A | -- | None Available | |
| Rogers Frances | -- | None Available | |
| Mease Richard A | -- | None Available | |
| Mease Richard A | -- | Fidelity-Riverside | |
| Mease Richard A | $255,500 | Fidelity-Riverside |
Source: Public Records
Mortgage History
| Date | Status | Borrower | Loan Amount |
|---|---|---|---|
| Previous Owner | Mease Cheryl E | $100,000 | |
| Previous Owner | Mease Richard A | $84,000 | |
| Previous Owner | Mease Richard | $320,000 | |
| Previous Owner | Mease Richard A | $253,500 | |
| Previous Owner | Mease Richard A | $242,350 |
Source: Public Records
Tax History Compared to Growth
Tax History
| Year | Tax Paid | Tax Assessment Tax Assessment Total Assessment is a certain percentage of the fair market value that is determined by local assessors to be the total taxable value of land and additions on the property. | Land | Improvement |
|---|---|---|---|---|
| 2024 | $5,220 | $354,727 | $42,352 | $312,375 |
| 2023 | $5,181 | $347,772 | $41,522 | $306,250 |
| 2022 | $5,111 | $340,953 | $40,708 | $300,245 |
| 2021 | $4,998 | $334,268 | $39,910 | $294,358 |
| 2020 | $4,926 | $330,841 | $39,501 | $291,340 |
| 2019 | $4,791 | $325,178 | $38,237 | $286,941 |
| 2018 | $4,825 | $299,900 | $60,500 | $239,400 |
| 2017 | $4,547 | $279,000 | $56,300 | $222,700 |
| 2016 | $4,586 | $258,300 | $52,100 | $206,200 |
| 2015 | $4,247 | $238,000 | $48,000 | $190,000 |
| 2014 | $3,630 | $189,800 | $38,000 | $151,800 |
Source: Public Records
Map
Nearby Homes
- 13784 Obispo Way
- 13815 Valera Way
- 13561 Monterey Way
- 13576 Monterey Way
- 0 Dos Palmas Rd Unit HD24035567
- 13657 Calzado Ct
- 13657 Cordelia Way
- 13357 Jenna Ct
- 13261 Falcon Trail
- 14141 Cholame Rd
- 0 Amethyst Rd Unit HD23185248
- 0 Amethyst Rd Unit CV22260994
- 0 Luna Rd Unit 530105
- 39604309 Dos Palmas Rd
- 0 Cholame Rd Unit OC25089796
- 0 Cholame Rd Unit HD24010462
- 14153 Americana St
- 13382 Adler St
- 13415 Alcott St
- 14284 Luna Rd