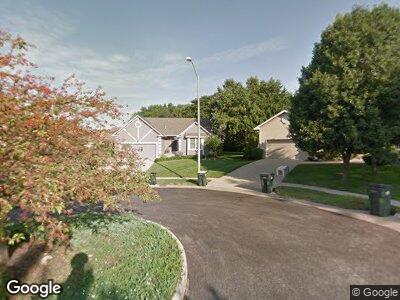
13644 Manor Overland Park, KS 66224
Estimated Value: $495,682 - $600,000
2
Beds
2
Baths
1,882
Sq Ft
$287/Sq Ft
Est. Value
About This Home
This home is located at 13644 Manor, Overland Park, KS 66224 and is currently estimated at $539,921, approximately $286 per square foot. 13644 Manor is a home located in Johnson County with nearby schools including Prairie Star Elementary School, Prairie Star Middle School, and Blue Valley High School.
Ownership History
Date
Name
Owned For
Owner Type
Purchase Details
Closed on
Nov 14, 2016
Sold by
Shields Dennis A and Shields Rebecca S
Bought by
Cott Ronald K and Cott Mary J
Current Estimated Value
Home Financials for this Owner
Home Financials are based on the most recent Mortgage that was taken out on this home.
Original Mortgage
$332,400
Outstanding Balance
$271,121
Interest Rate
3.42%
Mortgage Type
New Conventional
Estimated Equity
$276,264
Purchase Details
Closed on
Jun 28, 2006
Sold by
Flavin Mary L
Bought by
Shields Dennis A and Shields Rebecca S
Home Financials for this Owner
Home Financials are based on the most recent Mortgage that was taken out on this home.
Original Mortgage
$232,000
Interest Rate
6.79%
Mortgage Type
New Conventional
Create a Home Valuation Report for This Property
The Home Valuation Report is an in-depth analysis detailing your home's value as well as a comparison with similar homes in the area
Home Values in the Area
Average Home Value in this Area
Purchase History
| Date | Buyer | Sale Price | Title Company |
|---|---|---|---|
| Cott Ronald K | -- | Continental Title Company | |
| Shields Dennis A | -- | Kansas City Title |
Source: Public Records
Mortgage History
| Date | Status | Borrower | Loan Amount |
|---|---|---|---|
| Open | Cott Ronald K | $150,000 | |
| Open | Cott Ronald K | $332,400 | |
| Previous Owner | Shields Dennis A | $25,000 | |
| Previous Owner | Shields Dennis A | $221,700 | |
| Previous Owner | Shields Dennis A | $28,800 | |
| Previous Owner | Sheilds Dennis A | $232,000 | |
| Previous Owner | Shields Dennis A | $232,000 | |
| Previous Owner | Shields Dennis A | $224,000 |
Source: Public Records
Tax History Compared to Growth
Tax History
| Year | Tax Paid | Tax Assessment Tax Assessment Total Assessment is a certain percentage of the fair market value that is determined by local assessors to be the total taxable value of land and additions on the property. | Land | Improvement |
|---|---|---|---|---|
| 2024 | $5,292 | $48,058 | $10,536 | $37,522 |
| 2023 | $5,297 | $47,230 | $10,536 | $36,694 |
| 2022 | $4,715 | $41,204 | $10,536 | $30,668 |
| 2021 | $4,476 | $37,237 | $9,578 | $27,659 |
| 2020 | $4,849 | $39,491 | $9,578 | $29,913 |
| 2019 | $4,599 | $36,811 | $9,578 | $27,233 |
| 2018 | $4,517 | $35,512 | $8,708 | $26,804 |
| 2017 | $4,502 | $34,799 | $7,254 | $27,545 |
| 2016 | $3,644 | $28,267 | $6,307 | $21,960 |
| 2015 | $3,588 | $27,497 | $6,307 | $21,190 |
| 2013 | -- | $25,818 | $5,734 | $20,084 |
Source: Public Records
Map
Nearby Homes
- 2645 W 137th Terrace
- 13704 Pembroke Cir
- 13708 Pembroke Cir
- 13706 Pembroke Ln
- 13702 Pembroke Ln
- 13709 Pembroke Ln
- 13707 Pembroke Ln
- 13749 Pembroke Ln
- 13849 Pembroke Dr
- 3903 W 158th Terrace
- 3216 W 137th St
- 13814 Meadow Ln
- 2024 W 139th St
- 13284 High Dr
- 13945 Kenneth Ct
- 13810 Howe Ln
- 13806 Howe Ln
- 13802 Howe Ln
- 13801 Howe Ln
- 13805 Howe Ln