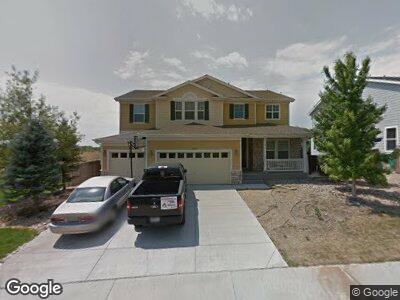
13757 Ivanhoe St Thornton, CO 80602
Springvale NeighborhoodEstimated Value: $643,000 - $689,000
4
Beds
3
Baths
4,463
Sq Ft
$151/Sq Ft
Est. Value
About This Home
This home is located at 13757 Ivanhoe St, Thornton, CO 80602 and is currently estimated at $672,518, approximately $150 per square foot. 13757 Ivanhoe St is a home located in Adams County with nearby schools including West Ridge Elementary School, Rodger Quist Middle School, and Riverdale Ridge High School.
Ownership History
Date
Name
Owned For
Owner Type
Purchase Details
Closed on
Sep 29, 2011
Sold by
Federal Home Loan Mortgage Corporation
Bought by
Shireman Steven W and Shireman Melinda A
Current Estimated Value
Home Financials for this Owner
Home Financials are based on the most recent Mortgage that was taken out on this home.
Original Mortgage
$272,902
Interest Rate
3.87%
Mortgage Type
FHA
Purchase Details
Closed on
Sep 30, 2010
Sold by
Shah Hansa H
Bought by
Federal Home Loan Mortgage Corp
Purchase Details
Closed on
Aug 29, 2006
Sold by
Kbone Llc
Bought by
Shah Hansa H
Home Financials for this Owner
Home Financials are based on the most recent Mortgage that was taken out on this home.
Original Mortgage
$73,180
Interest Rate
6.64%
Mortgage Type
Stand Alone Second
Create a Home Valuation Report for This Property
The Home Valuation Report is an in-depth analysis detailing your home's value as well as a comparison with similar homes in the area
Home Values in the Area
Average Home Value in this Area
Purchase History
| Date | Buyer | Sale Price | Title Company |
|---|---|---|---|
| Shireman Steven W | $280,000 | Servicelink | |
| Federal Home Loan Mortgage Corp | -- | None Available | |
| Shah Hansa H | $365,900 | Security Title |
Source: Public Records
Mortgage History
| Date | Status | Borrower | Loan Amount |
|---|---|---|---|
| Open | Shireman Steven W | $37,367 | |
| Closed | Shireman Steven W | $17,813 | |
| Open | Shireman Steven W | $334,757 | |
| Closed | Shireman Steven W | $333,740 | |
| Closed | Shireman Steven W | $205,802 | |
| Closed | Sosa Joel David | $294,057 | |
| Closed | Shireman Steven W | $74,687 | |
| Closed | Shireman Steven W | $272,902 | |
| Previous Owner | Shah Hansa H | $73,180 | |
| Previous Owner | Shah Hansa H | $292,720 |
Source: Public Records
Tax History Compared to Growth
Tax History
| Year | Tax Paid | Tax Assessment Tax Assessment Total Assessment is a certain percentage of the fair market value that is determined by local assessors to be the total taxable value of land and additions on the property. | Land | Improvement |
|---|---|---|---|---|
| 2024 | $4,261 | $44,010 | $6,380 | $37,630 |
| 2023 | $4,261 | $47,630 | $6,900 | $40,730 |
| 2022 | $3,356 | $34,220 | $7,090 | $27,130 |
| 2021 | $3,233 | $34,220 | $7,090 | $27,130 |
| 2020 | $3,099 | $34,240 | $7,290 | $26,950 |
| 2019 | $3,103 | $34,240 | $7,290 | $26,950 |
| 2018 | $2,835 | $31,270 | $6,840 | $24,430 |
| 2017 | $2,831 | $31,270 | $6,840 | $24,430 |
| 2016 | $2,529 | $27,830 | $4,140 | $23,690 |
| 2015 | $2,523 | $27,830 | $4,140 | $23,690 |
| 2014 | $2,019 | $22,620 | $3,500 | $19,120 |
Source: Public Records
Map
Nearby Homes
- 13871 Ivy St
- 13753 Jasmine St
- 13915 Ivanhoe St
- 13960 Grape St
- 13955 Grape St
- 13818 Krameria St
- 13601 Krameria St
- 13964 Fairfax St
- 13878 Elm St
- 13684 Lilac St
- 13900 Eudora St
- 13899 Eudora St
- 13959 Eudora St
- 14160 Ivanhoe St
- 6402 E 136th Place
- 13415 Kearney St
- 14221 Ivanhoe St
- 13686 Dexter St
- 14241 Ivanhoe St
- 14240 Ivanhoe St