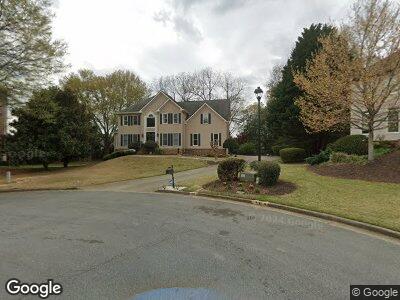
1390 Chelsey Ln Alpharetta, GA 30004
Estimated Value: $820,000 - $930,000
4
Beds
5
Baths
2,760
Sq Ft
$312/Sq Ft
Est. Value
About This Home
This home is located at 1390 Chelsey Ln, Alpharetta, GA 30004 and is currently estimated at $861,838, approximately $312 per square foot. 1390 Chelsey Ln is a home located in Fulton County with nearby schools including Crabapple Crossing Elementary School, Northwestern Middle School, and Milton High School.
Ownership History
Date
Name
Owned For
Owner Type
Purchase Details
Closed on
Feb 26, 2010
Sold by
Meade Eric A and Meade Kristina M
Bought by
Lage Dean L and Lage Gabriela
Current Estimated Value
Home Financials for this Owner
Home Financials are based on the most recent Mortgage that was taken out on this home.
Original Mortgage
$289,120
Interest Rate
4.97%
Mortgage Type
New Conventional
Purchase Details
Closed on
Jul 28, 2003
Sold by
Johnson Thomas G and Johnson Hilary A
Bought by
Meade Eric A and Meade Kristina
Home Financials for this Owner
Home Financials are based on the most recent Mortgage that was taken out on this home.
Original Mortgage
$244,000
Interest Rate
4.38%
Mortgage Type
New Conventional
Purchase Details
Closed on
Aug 15, 1996
Sold by
Contrinc Pritchard
Bought by
Johnson Thomas Hilary
Create a Home Valuation Report for This Property
The Home Valuation Report is an in-depth analysis detailing your home's value as well as a comparison with similar homes in the area
Home Values in the Area
Average Home Value in this Area
Purchase History
| Date | Buyer | Sale Price | Title Company |
|---|---|---|---|
| Lage Dean L | $361,600 | -- | |
| Meade Eric A | $305,000 | -- | |
| Johnson Thomas Hilary | $239,900 | -- |
Source: Public Records
Mortgage History
| Date | Status | Borrower | Loan Amount |
|---|---|---|---|
| Open | Lage Gabriela | $272,000 | |
| Closed | Lage Dean L | $289,120 | |
| Previous Owner | Meade Eric A | $260,675 | |
| Previous Owner | Meade Eric A | $244,000 | |
| Closed | Johnson Thomas Hilary | $0 |
Source: Public Records
Tax History Compared to Growth
Tax History
| Year | Tax Paid | Tax Assessment Tax Assessment Total Assessment is a certain percentage of the fair market value that is determined by local assessors to be the total taxable value of land and additions on the property. | Land | Improvement |
|---|---|---|---|---|
| 2023 | $6,403 | $226,840 | $47,880 | $178,960 |
| 2022 | $4,068 | $226,840 | $47,880 | $178,960 |
| 2021 | $698 | $169,480 | $38,200 | $131,280 |
| 2020 | $4,682 | $156,000 | $36,920 | $119,080 |
| 2019 | $719 | $183,200 | $50,800 | $132,400 |
| 2018 | $4,483 | $178,920 | $49,640 | $129,280 |
| 2017 | $3,954 | $147,480 | $37,000 | $110,480 |
| 2016 | $3,953 | $147,480 | $37,000 | $110,480 |
| 2015 | $4,617 | $147,480 | $37,000 | $110,480 |
| 2014 | $3,749 | $135,040 | $33,880 | $101,160 |
Source: Public Records
Map
Nearby Homes
- 12720 Bethany Rd Unit A
- 12720 Bethany Rd
- 12740 Bethany Rd
- 12734 Bethany Rd
- 12805 Bethany Rd
- 110 Myers Dr
- 1210 Mayfield Rd
- 1310 Rumson Ln
- 1065 Mid Broadwell Rd
- 140 Pruitt Dr
- 7412 Mid Broadwell Trace
- 275 Heatherton Way
- 1004 Baldwin Dr
- 135 Pruitt Dr
- 1185 Marka Ln
- 884 Mayfield Rd
- 2004 Cortland Rd
- 2062 Cortland Rd
- 2068 Cortland Rd