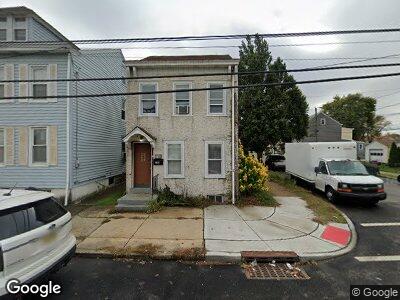
141 Henry St Trenton, NJ 08611
South Trenton NeighborhoodEstimated Value: $248,000 - $318,000
4
Beds
1
Bath
1,280
Sq Ft
$217/Sq Ft
Est. Value
About This Home
This home is located at 141 Henry St, Trenton, NJ 08611 and is currently estimated at $278,333, approximately $217 per square foot. 141 Henry St is a home located in Mercer County with nearby schools including Lalor Elementary School, Richard C. Crockett Middle School, and Hamilton West-Watson High School.
Ownership History
Date
Name
Owned For
Owner Type
Purchase Details
Closed on
Nov 14, 2023
Sold by
Lederberger Israel
Bought by
Mercer County Portfolio Llc
Current Estimated Value
Home Financials for this Owner
Home Financials are based on the most recent Mortgage that was taken out on this home.
Original Mortgage
$469,000
Outstanding Balance
$464,668
Interest Rate
7.49%
Mortgage Type
New Conventional
Estimated Equity
-$207,001
Purchase Details
Closed on
Oct 11, 2019
Sold by
Eres Elisa and Simas John M
Bought by
Lederberger Israel
Purchase Details
Closed on
Jul 14, 2004
Sold by
Rapciewicz George
Bought by
Simas John and Eres Elisa
Home Financials for this Owner
Home Financials are based on the most recent Mortgage that was taken out on this home.
Original Mortgage
$147,200
Interest Rate
5.68%
Create a Home Valuation Report for This Property
The Home Valuation Report is an in-depth analysis detailing your home's value as well as a comparison with similar homes in the area
Home Values in the Area
Average Home Value in this Area
Purchase History
| Date | Buyer | Sale Price | Title Company |
|---|---|---|---|
| Mercer County Portfolio Llc | -- | Dekel Abstract | |
| Lederberger Israel | $53,500 | None Available | |
| Simas John | $184,000 | -- |
Source: Public Records
Mortgage History
| Date | Status | Borrower | Loan Amount |
|---|---|---|---|
| Open | Mercer County Portfolio Llc | $469,000 | |
| Previous Owner | Simas John | $147,200 |
Source: Public Records
Tax History Compared to Growth
Tax History
| Year | Tax Paid | Tax Assessment Tax Assessment Total Assessment is a certain percentage of the fair market value that is determined by local assessors to be the total taxable value of land and additions on the property. | Land | Improvement |
|---|---|---|---|---|
| 2024 | $4,205 | $127,300 | $24,200 | $103,100 |
| 2023 | $4,205 | $127,300 | $24,200 | $103,100 |
| 2022 | $4,139 | $127,300 | $24,200 | $103,100 |
| 2021 | $5,121 | $127,300 | $24,200 | $103,100 |
| 2020 | $4,663 | $127,300 | $24,200 | $103,100 |
| 2019 | $4,526 | $127,300 | $24,200 | $103,100 |
| 2018 | $4,466 | $127,300 | $24,200 | $103,100 |
| 2017 | $4,488 | $133,900 | $24,200 | $109,700 |
| 2016 | $3,621 | $133,900 | $24,200 | $109,700 |
| 2015 | $4,037 | $77,500 | $19,100 | $58,400 |
| 2014 | $3,984 | $77,500 | $19,100 | $58,400 |
Source: Public Records