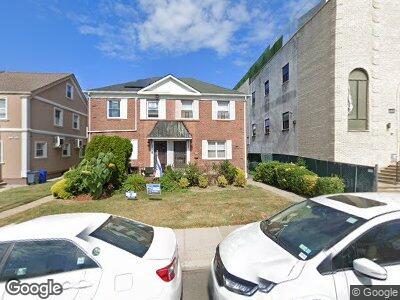
14139 72nd Ave Flushing, NY 11367
Kew Gardens Hills NeighborhoodEstimated Value: $1,003,000 - $1,012,000
3
Beds
3
Baths
1,224
Sq Ft
$823/Sq Ft
Est. Value
About This Home
This home is located at 14139 72nd Ave, Flushing, NY 11367 and is currently estimated at $1,006,794, approximately $822 per square foot. 14139 72nd Ave is a home located in Queens County with nearby schools including P.S. 164 - Queens Valley, I.S. 250 - The Robert F. Kennedy Community Middle School, and Yeshiva Of Central Queens.
Ownership History
Date
Name
Owned For
Owner Type
Purchase Details
Closed on
Oct 20, 2021
Sold by
Berger David
Bought by
Cbbm Realty Llc
Current Estimated Value
Purchase Details
Closed on
Nov 7, 2019
Sold by
Cbbm Realty Llc
Bought by
Berger David
Home Financials for this Owner
Home Financials are based on the most recent Mortgage that was taken out on this home.
Original Mortgage
$726,525
Interest Rate
3.65%
Mortgage Type
Purchase Money Mortgage
Purchase Details
Closed on
Jul 10, 2014
Sold by
Elbaz Amram and Elbaz Roselyn
Bought by
Cbbm Realty Llc
Purchase Details
Closed on
Jun 13, 2000
Sold by
Barcklow John J
Bought by
Elbaz Amram and Elbaz Roselyn
Home Financials for this Owner
Home Financials are based on the most recent Mortgage that was taken out on this home.
Original Mortgage
$204,000
Interest Rate
8.18%
Create a Home Valuation Report for This Property
The Home Valuation Report is an in-depth analysis detailing your home's value as well as a comparison with similar homes in the area
Home Values in the Area
Average Home Value in this Area
Purchase History
| Date | Buyer | Sale Price | Title Company |
|---|---|---|---|
| Cbbm Realty Llc | -- | -- | |
| Berger David | -- | -- | |
| Cbbm Realty Llc | $640,000 | -- | |
| Elbaz Amram | $256,000 | -- |
Source: Public Records
Mortgage History
| Date | Status | Borrower | Loan Amount |
|---|---|---|---|
| Previous Owner | Berger David | $726,525 | |
| Previous Owner | Elbaz Amram | $6,098 | |
| Previous Owner | Elbaz Amram | $11,031 | |
| Previous Owner | Elbaz Amram | $117,391 | |
| Previous Owner | Elbaz Amram | $100,000 | |
| Previous Owner | Elbaz Amram | $3,507 | |
| Previous Owner | Elbaz Amram | $204,000 |
Source: Public Records
Tax History Compared to Growth
Tax History
| Year | Tax Paid | Tax Assessment Tax Assessment Total Assessment is a certain percentage of the fair market value that is determined by local assessors to be the total taxable value of land and additions on the property. | Land | Improvement |
|---|---|---|---|---|
| 2024 | $9,031 | $44,966 | $14,132 | $30,834 |
| 2023 | $8,520 | $42,422 | $14,106 | $28,316 |
| 2022 | $7,989 | $47,460 | $16,500 | $30,960 |
| 2021 | $7,946 | $49,020 | $16,500 | $32,520 |
| 2020 | $6,032 | $46,380 | $16,500 | $29,880 |
| 2019 | $7,839 | $45,840 | $16,500 | $29,340 |
| 2018 | $7,206 | $35,352 | $13,693 | $21,659 |
| 2017 | $6,799 | $33,351 | $14,512 | $18,839 |
| 2016 | $6,290 | $33,351 | $14,512 | $18,839 |
| 2015 | $3,575 | $31,464 | $15,186 | $16,278 |
| 2014 | $3,575 | $31,227 | $17,311 | $13,916 |
Source: Public Records
Map
Nearby Homes
- 141-09 72nd Ave
- 141-40 72nd Ave
- 144-21 72nd Ave Unit B
- 144-16 72nd Ave Unit B
- 144-46 72 Ave Unit B
- 137-62 70th Rd
- 136-49 71st Rd
- 70-37 Vleigh Place
- 13637 72nd Ave
- 137-49 70th Rd
- 136-08 71st Rd
- 144-24 Jewel Ave
- 144-37 73rd Ave
- 14163 73rd Terrace
- 147-39 71st Ave Unit 2a
- 138-55 Jewel Ave Unit 2nd Fl
- 144-44 Jewel Ave
- 138-53 Jewel Ave Unit B
- 144-52 Jewel Ave
- 147-27 72nd Dr