J
Seller's Agent in 2024
Janet Allen
Realty Executives
(623) 680-6868
6 in this area
16 Total Sales
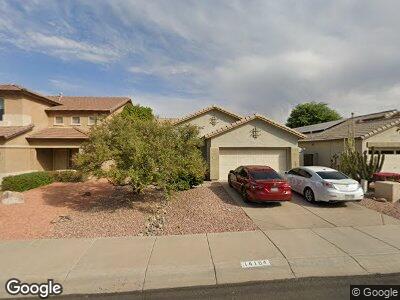
This cute 4-bedroom home is close to Western Sky and Millennium Schools. Easy reach to grocery stores and the Great Wigwam Resort with golfing, concerts, and restaurants. Granite countertops, stainless steel appliances, and laminate plank flooring in neutral colors. Enjoy this home in this sought-after area with recreation parks nearby—easy access to I-10, 303, and 101 Loops. Spring training grounds are within a few miles of the property.
| Date | Buyer | Sale Price | Title Company |
|---|---|---|---|
| Lemke Rober L | -- | None Available | |
| Jirc Llc | -- | None Available | |
| Baxter Randall S | $230,000 | Security Title Agency Inc | |
| Chang Coralie B L | $122,816 | Security Title Agency | |
| Fulton Homes Sales Corp | $101,103 | Security Title Agency |
| Date | Status | Borrower | Loan Amount |
|---|---|---|---|
| Previous Owner | Baxter Randall S | $184,000 | |
| Previous Owner | Chang Coralie B L | $116,600 | |
| Previous Owner | Chang Coralie B L | $112,500 |
| Date | Event | Price | Change | Sq Ft Price |
|---|---|---|---|---|
| 12/08/2024 12/08/24 | Rented | $1,995 | 0.0% | -- |
| 11/24/2024 11/24/24 | Price Changed | $1,995 | -4.8% | $1 / Sq Ft |
| 11/10/2024 11/10/24 | Price Changed | $2,095 | -4.6% | $1 / Sq Ft |
| 09/22/2024 09/22/24 | For Rent | $2,195 | +10.0% | -- |
| 01/01/2024 01/01/24 | Rented | $1,995 | 0.0% | -- |
| 12/28/2023 12/28/23 | Sold | $415,000 | 0.0% | $251 / Sq Ft |
| 12/19/2023 12/19/23 | Price Changed | $1,995 | -4.8% | $1 / Sq Ft |
| 12/08/2023 12/08/23 | For Rent | $2,095 | 0.0% | -- |
| 11/22/2023 11/22/23 | Pending | -- | -- | -- |
| 10/29/2023 10/29/23 | Price Changed | $419,200 | +1.0% | $253 / Sq Ft |
| 10/24/2023 10/24/23 | Price Changed | $415,000 | -3.5% | $251 / Sq Ft |
| 10/13/2023 10/13/23 | Price Changed | $430,000 | +2.4% | $260 / Sq Ft |
| 09/19/2023 09/19/23 | Price Changed | $419,900 | -1.3% | $254 / Sq Ft |
| 09/13/2023 09/13/23 | Price Changed | $425,500 | -3.1% | $257 / Sq Ft |
| 08/25/2023 08/25/23 | Price Changed | $439,000 | -6.4% | $265 / Sq Ft |
| 07/23/2023 07/23/23 | Price Changed | $469,000 | -1.1% | $283 / Sq Ft |
| 07/03/2023 07/03/23 | For Sale | $474,000 | 0.0% | $286 / Sq Ft |
| 12/23/2017 12/23/17 | Rented | $1,400 | 0.0% | -- |
| 10/09/2017 10/09/17 | For Rent | $1,400 | +27.3% | -- |
| 04/23/2014 04/23/14 | Rented | $1,100 | 0.0% | -- |
| 04/19/2014 04/19/14 | Under Contract | -- | -- | -- |
| 04/06/2014 04/06/14 | For Rent | $1,100 | -12.0% | -- |
| 03/26/2014 03/26/14 | Rented | $1,250 | +19.0% | -- |
| 03/22/2014 03/22/14 | Under Contract | -- | -- | -- |
| 03/04/2014 03/04/14 | For Rent | $1,050 | -- | -- |
| Year | Tax Paid | Tax Assessment Tax Assessment Total Assessment is a certain percentage of the fair market value that is determined by local assessors to be the total taxable value of land and additions on the property. | Land | Improvement |
|---|---|---|---|---|
| 2025 | $1,767 | $16,556 | -- | -- |
| 2024 | $1,735 | $15,768 | -- | -- |
| 2023 | $1,735 | $28,070 | $5,610 | $22,460 |
| 2022 | $1,670 | $21,680 | $4,330 | $17,350 |
| 2021 | $1,787 | $20,420 | $4,080 | $16,340 |
| 2020 | $1,719 | $18,910 | $3,780 | $15,130 |
| 2019 | $1,712 | $17,030 | $3,400 | $13,630 |
| 2018 | $1,671 | $16,880 | $3,370 | $13,510 |
| 2017 | $1,565 | $14,970 | $2,990 | $11,980 |
| 2016 | $1,468 | $14,830 | $2,960 | $11,870 |
| 2015 | $1,510 | $12,930 | $2,580 | $10,350 |
J
Seller's Agent in 2024
Janet Allen
Realty Executives
(623) 680-6868
6 in this area
16 Total Sales
R
Seller's Agent in 2023
Randall Baxter
AZ Marketplace Realty
(623) 742-5854
3 in this area
9 Total Sales

Seller's Agent in 2014
Rebecca Everett
M.A.Z. Realty Professionals
(623) 640-3150
13 Total Sales
Buyer's Agent in 2014
Leokadia Cooper
Cooper Fine Properties LLC
L
Buyer's Agent in 2014
Leokadia GRI
Russ Lyon Sotheby's International Realty