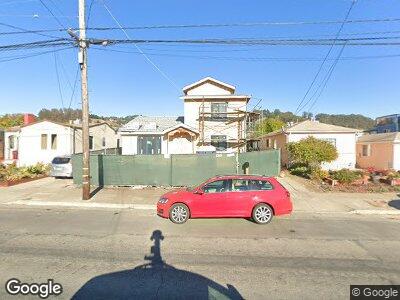
1420 Richmond St El Cerrito, CA 94530
Estimated Value: $876,000 - $916,000
2
Beds
2
Baths
1,002
Sq Ft
$896/Sq Ft
Est. Value
About This Home
This home is located at 1420 Richmond St, El Cerrito, CA 94530 and is currently estimated at $897,302, approximately $895 per square foot. 1420 Richmond St is a home located in Contra Costa County with nearby schools including Madera Elementary School, Fred T. Korematsu Middle School, and El Cerrito Senior High School.
Ownership History
Date
Name
Owned For
Owner Type
Purchase Details
Closed on
Sep 2, 2020
Sold by
Unger Mark
Bought by
Fox Pamela and Gray Elliott
Current Estimated Value
Purchase Details
Closed on
Mar 18, 2013
Sold by
Rider David T and Rider Christine J
Bought by
Feeney Michael and Feeney Krishna P
Home Financials for this Owner
Home Financials are based on the most recent Mortgage that was taken out on this home.
Original Mortgage
$332,000
Interest Rate
3.49%
Mortgage Type
New Conventional
Purchase Details
Closed on
Jan 24, 2006
Sold by
Rider David T and Rider Christine J
Bought by
Rider David T and Rider Christine J
Purchase Details
Closed on
Jan 29, 2004
Sold by
Rider Richard H and Rider David T
Bought by
Rider David T and Rider Christine J
Purchase Details
Closed on
Sep 17, 2001
Sold by
Rider Themla G
Bought by
Rider Thelma G and Rider Richard H
Create a Home Valuation Report for This Property
The Home Valuation Report is an in-depth analysis detailing your home's value as well as a comparison with similar homes in the area
Home Values in the Area
Average Home Value in this Area
Purchase History
| Date | Buyer | Sale Price | Title Company |
|---|---|---|---|
| Fox Pamela | $1,105,000 | Old Republic Title Company | |
| Feeney Michael | $415,000 | Chicago Title Company | |
| Rider David T | -- | First American Title | |
| Rider David T | -- | First American Title | |
| Rider David T | -- | -- | |
| Rider Thelma G | -- | -- |
Source: Public Records
Mortgage History
| Date | Status | Borrower | Loan Amount |
|---|---|---|---|
| Open | Feeney Michael | $781,000 | |
| Closed | Feeney Michael | $400,000 | |
| Previous Owner | Feeney Michael | $332,000 | |
| Previous Owner | Rider David T | $358,877 | |
| Previous Owner | Rider David T | $375,000 |
Source: Public Records
Tax History Compared to Growth
Tax History
| Year | Tax Paid | Tax Assessment Tax Assessment Total Assessment is a certain percentage of the fair market value that is determined by local assessors to be the total taxable value of land and additions on the property. | Land | Improvement |
|---|---|---|---|---|
| 2024 | $7,402 | $501,012 | $362,180 | $138,832 |
| 2023 | $7,402 | $491,189 | $355,079 | $136,110 |
| 2022 | $7,282 | $481,559 | $348,117 | $133,442 |
| 2021 | $7,241 | $472,118 | $341,292 | $130,826 |
| 2019 | $6,787 | $458,117 | $331,170 | $126,947 |
| 2018 | $6,551 | $449,135 | $324,677 | $124,458 |
| 2017 | $6,451 | $440,329 | $318,311 | $122,018 |
| 2016 | $6,427 | $431,696 | $312,070 | $119,626 |
| 2015 | $6,452 | $425,213 | $307,383 | $117,830 |
| 2014 | $6,390 | $416,884 | $301,362 | $115,522 |
Source: Public Records
Map
Nearby Homes
- 7007 Manila Ave
- 10280 San Pablo Ave
- 10496 San Pablo Ave
- 5801 Madison Ave
- 5955 Wenk Ave
- 1006 Richmond St
- 5920 Orchard Ave
- 1852 Key Blvd
- 5350 Gately Ave
- 5216 School St
- 1550 Regency Ct
- 5314 Bayview Ave
- 7788 Moeser Ln
- 1335 Contra Costa Dr
- 855 Liberty St
- 1564 Mariposa St
- 2008 Tamalpais Ave
- 924 Balra Dr
- 7451 Stockton Ave
- 7755 Earl Ct