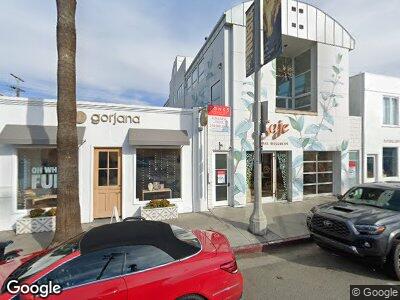
1421 Abbot Kinney Blvd Los Angeles, CA 90291
Venice NeighborhoodEstimated Value: $4,931,875
--
Bed
2
Baths
1,900
Sq Ft
$2,596/Sq Ft
Est. Value
About This Home
This home is located at 1421 Abbot Kinney Blvd, Los Angeles, CA 90291 and is currently estimated at $4,931,875, approximately $2,595 per square foot. 1421 Abbot Kinney Blvd is a home located in Los Angeles County with nearby schools including Westminster Avenue Elementary School, Mark Twain Middle School, and Venice High School.
Ownership History
Date
Name
Owned For
Owner Type
Purchase Details
Closed on
Jun 17, 2013
Sold by
Cockney Rubble
Bought by
Cockney Rubble Llc
Current Estimated Value
Purchase Details
Closed on
Sep 29, 2003
Sold by
Smillie Peter
Bought by
Splash Mountain Resorts
Home Financials for this Owner
Home Financials are based on the most recent Mortgage that was taken out on this home.
Original Mortgage
$995,500
Interest Rate
5.72%
Mortgage Type
Commercial
Purchase Details
Closed on
Jul 9, 1997
Sold by
Sherer Freda Korb
Bought by
Smillie Peter and Smillie Stephanie
Purchase Details
Closed on
Oct 4, 1994
Sold by
Waisler Lee
Bought by
Sherer Freda Korb and Korb David
Create a Home Valuation Report for This Property
The Home Valuation Report is an in-depth analysis detailing your home's value as well as a comparison with similar homes in the area
Home Values in the Area
Average Home Value in this Area
Purchase History
| Date | Buyer | Sale Price | Title Company |
|---|---|---|---|
| Cockney Rubble Llc | -- | Accommodation | |
| Splash Mountain Resorts | $1,950,000 | Stewart Title Co | |
| Smillie Peter | -- | Commonwealth Land Title Co | |
| Sherer Freda Korb | -- | -- |
Source: Public Records
Mortgage History
| Date | Status | Borrower | Loan Amount |
|---|---|---|---|
| Open | Cockney Rubble Llc | $4,600,000 | |
| Closed | Cockney Rubble Llc | $3,450,000 | |
| Previous Owner | Splash Mountain Resorts | $1,040,000 | |
| Previous Owner | Splash Mountain Resorts | $2,100,000 | |
| Previous Owner | Splash Mountain Resorts | $995,500 | |
| Closed | Splash Mountain Resorts | $700,000 |
Source: Public Records
Tax History Compared to Growth
Tax History
| Year | Tax Paid | Tax Assessment Tax Assessment Total Assessment is a certain percentage of the fair market value that is determined by local assessors to be the total taxable value of land and additions on the property. | Land | Improvement |
|---|---|---|---|---|
| 2024 | $32,978 | $2,718,125 | $1,393,912 | $1,324,213 |
| 2023 | $32,335 | $2,664,830 | $1,366,581 | $1,298,249 |
| 2022 | $30,821 | $2,612,580 | $1,339,786 | $1,272,794 |
| 2021 | $30,449 | $2,561,354 | $1,313,516 | $1,247,838 |
| 2019 | $29,530 | $2,485,384 | $1,274,557 | $1,210,827 |
| 2018 | $29,440 | $2,436,652 | $1,249,566 | $1,187,086 |
| 2017 | $28,797 | $2,388,875 | $1,225,065 | $1,163,810 |
| 2016 | $28,171 | $2,342,036 | $1,201,045 | $1,140,991 |
| 2015 | $27,755 | $2,306,858 | $1,183,005 | $1,123,853 |
| 2014 | -- | $3,100,000 | $2,350,000 | $750,000 |
Source: Public Records
Map
Nearby Homes
- 1510 Electric Ave
- 1337 6th Ave
- 538 Rialto Ave
- 524 Rialto Ave
- 533 Grand Blvd
- 1309 Cabrillo Ave
- 633 Santa Clara Ave
- 1223 Cabrillo Ave
- 1308 Cabrillo Ave
- 1601 Shell Ave
- 717 California Ave
- 1520 Andalusia Ave
- 580 Venice Blvd
- 504 Grand Blvd
- 325 Windward Ave
- 1702 Abbot Kinney Blvd
- 419 Rialto Ave
- 308 Windward Ave
- 1201 Cabrillo Ave
- 635 San Juan Ave