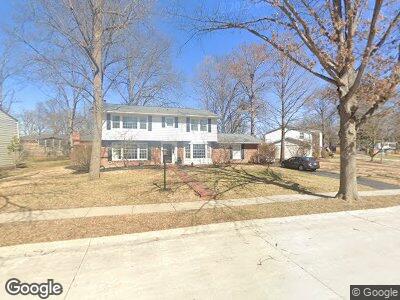
1421 Northlin Dr Saint Louis, MO 63122
Estimated Value: $560,000 - $766,000
4
Beds
3
Baths
2,272
Sq Ft
$285/Sq Ft
Est. Value
About This Home
This home is located at 1421 Northlin Dr, Saint Louis, MO 63122 and is currently estimated at $647,128, approximately $284 per square foot. 1421 Northlin Dr is a home located in St. Louis County with nearby schools including Westchester Elementary School, North Kirkwood Middle School, and Kirkwood Senior High School.
Ownership History
Date
Name
Owned For
Owner Type
Purchase Details
Closed on
Aug 11, 2011
Sold by
Greene Richard E and Greene Maryann A
Bought by
Grissom Adam and Grissom Sarah
Current Estimated Value
Home Financials for this Owner
Home Financials are based on the most recent Mortgage that was taken out on this home.
Original Mortgage
$312,000
Interest Rate
4.54%
Mortgage Type
New Conventional
Purchase Details
Closed on
Jul 26, 2011
Sold by
Greene Richard E
Bought by
Greene Richard E and Greene Mary A
Home Financials for this Owner
Home Financials are based on the most recent Mortgage that was taken out on this home.
Original Mortgage
$312,000
Interest Rate
4.54%
Mortgage Type
New Conventional
Purchase Details
Closed on
Nov 30, 2007
Sold by
Greene Richard E
Bought by
Greene Richard E and Richard E Greene Revocable Living Trust
Create a Home Valuation Report for This Property
The Home Valuation Report is an in-depth analysis detailing your home's value as well as a comparison with similar homes in the area
Home Values in the Area
Average Home Value in this Area
Purchase History
| Date | Buyer | Sale Price | Title Company |
|---|---|---|---|
| Grissom Adam | $390,000 | Investors Title Co Clayton | |
| Greene Richard E | -- | Investors Title Co Clayton | |
| Greene Richard E | -- | None Available | |
| Greene Richard E | -- | None Available |
Source: Public Records
Mortgage History
| Date | Status | Borrower | Loan Amount |
|---|---|---|---|
| Open | Adam | $308,200 | |
| Closed | Grissom Adam | $312,000 |
Source: Public Records
Tax History Compared to Growth
Tax History
| Year | Tax Paid | Tax Assessment Tax Assessment Total Assessment is a certain percentage of the fair market value that is determined by local assessors to be the total taxable value of land and additions on the property. | Land | Improvement |
|---|---|---|---|---|
| 2023 | $5,652 | $91,810 | $39,200 | $52,610 |
| 2022 | $5,702 | $86,430 | $39,200 | $47,230 |
| 2021 | $5,628 | $86,430 | $39,200 | $47,230 |
| 2020 | $5,190 | $76,610 | $31,830 | $44,780 |
| 2019 | $5,208 | $76,610 | $31,830 | $44,780 |
| 2018 | $5,398 | $70,150 | $26,660 | $43,490 |
| 2017 | $5,391 | $70,150 | $26,660 | $43,490 |
| 2016 | $5,225 | $68,520 | $22,860 | $45,660 |
| 2015 | $5,199 | $68,520 | $22,860 | $45,660 |
| 2014 | $5,199 | $67,030 | $15,030 | $52,000 |
Source: Public Records
Map
Nearby Homes
- 11910 Lillian Ave
- 11909 Lillian Ave
- 1025 Lindemann Rd
- 920 Des Peres Dr
- 1037 Pinegate Dr
- 1008 Woodgate Dr
- 1125 Lockett Rd
- 1126 Bopp Rd
- 11409 Manchester Rd
- 1902 Meadowtree Ln Unit 7
- 11327 Manchester Rd
- 2005 Woodland Knoll
- 1007 Edgeworth Ave
- 2017 Woodland Knoll
- 2002 Woodland Knoll
- 2037 Trailcrest Ln Unit 7
- 823 Cherry St
- 921 Bluebonnet Ct
- 2010 Woodland Knoll
- 2025 Woodland Knoll