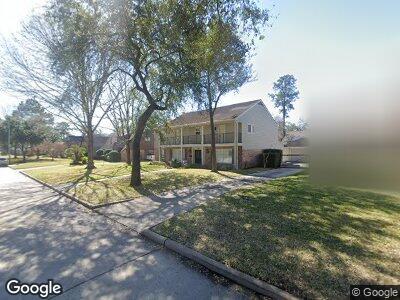
14347 Cindywood Dr Houston, TX 77079
Energy Corridor NeighborhoodEstimated Value: $989,000 - $1,195,000
4
Beds
3
Baths
3,056
Sq Ft
$360/Sq Ft
Est. Value
About This Home
This home is located at 14347 Cindywood Dr, Houston, TX 77079 and is currently estimated at $1,100,727, approximately $360 per square foot. 14347 Cindywood Dr is a home located in Harris County with nearby schools including Meadow Wood Elementary School, Spring Forest Middle School, and Stratford High School.
Ownership History
Date
Name
Owned For
Owner Type
Purchase Details
Closed on
Jul 23, 2015
Sold by
Eyberg Eric D and Teixeira Lethurzia
Bought by
Platt Andrew and Platt Laura
Current Estimated Value
Home Financials for this Owner
Home Financials are based on the most recent Mortgage that was taken out on this home.
Original Mortgage
$492,000
Outstanding Balance
$394,889
Interest Rate
4.08%
Mortgage Type
New Conventional
Estimated Equity
$681,258
Purchase Details
Closed on
Apr 15, 2010
Sold by
Reichle Damon and Reichle Robyn
Bought by
Eyberg Eric D and Teixeira Lethurzia
Home Financials for this Owner
Home Financials are based on the most recent Mortgage that was taken out on this home.
Original Mortgage
$410,000
Interest Rate
4.9%
Mortgage Type
New Conventional
Purchase Details
Closed on
Sep 29, 2006
Sold by
Sartori Anthony G and Sartori Beth P
Bought by
Reichle Damon and Reichle Robyn
Home Financials for this Owner
Home Financials are based on the most recent Mortgage that was taken out on this home.
Original Mortgage
$324,000
Interest Rate
6.51%
Mortgage Type
Purchase Money Mortgage
Create a Home Valuation Report for This Property
The Home Valuation Report is an in-depth analysis detailing your home's value as well as a comparison with similar homes in the area
Home Values in the Area
Average Home Value in this Area
Purchase History
| Date | Buyer | Sale Price | Title Company |
|---|---|---|---|
| Platt Andrew | -- | Tradition Title Co | |
| Eyberg Eric D | -- | Charter Title Company | |
| Reichle Damon | -- | Etc |
Source: Public Records
Mortgage History
| Date | Status | Borrower | Loan Amount |
|---|---|---|---|
| Open | Platt Andrew | $492,000 | |
| Previous Owner | Eyberg Eric D | $410,000 | |
| Previous Owner | Reichle Damon | $324,000 |
Source: Public Records
Tax History Compared to Growth
Tax History
| Year | Tax Paid | Tax Assessment Tax Assessment Total Assessment is a certain percentage of the fair market value that is determined by local assessors to be the total taxable value of land and additions on the property. | Land | Improvement |
|---|---|---|---|---|
| 2023 | $14,023 | $915,000 | $489,694 | $425,306 |
| 2022 | $16,544 | $707,629 | $414,106 | $293,523 |
| 2021 | $17,236 | $706,000 | $352,431 | $353,569 |
| 2020 | $16,080 | $641,777 | $352,431 | $289,346 |
| 2019 | $16,380 | $625,666 | $370,980 | $254,686 |
| 2018 | $4,954 | $506,179 | $370,980 | $135,199 |
| 2017 | $16,985 | $649,262 | $463,725 | $185,537 |
| 2016 | $16,089 | $615,000 | $463,725 | $151,275 |
| 2015 | $15,571 | $646,122 | $463,725 | $182,397 |
| 2014 | $15,571 | $585,017 | $315,333 | $269,684 |
Source: Public Records
Map
Nearby Homes
- 14318 Cindywood Dr
- 559 Kickerillo Dr
- 14427 Cindywood Dr
- 14406 Chadbourne Dr
- 14333 Memorial Dr Unit 44
- 14333 Memorial Dr Unit 39
- 14333 Memorial Dr Unit 75
- 14333 Memorial Dr Unit 24
- 14502 River Forest Dr
- 527 Kickerillo Dr
- 14426 Twisted Oak Ln
- 14218 Cindywood Dr
- 14526 Cindywood Dr
- 14514 Bramblewood Dr
- 710 Country Place Dr Unit D
- 625 Rancho Bauer Dr
- 716 Country Place Dr Unit D
- 14530 Bramblewood Dr
- 724 Country Place Dr Unit G
- 410 Hickory Post Ln