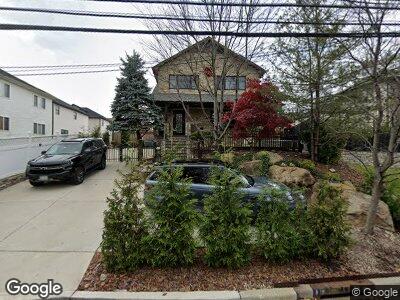
145 Richmond Valley Rd Staten Island, NY 10309
Charleston NeighborhoodEstimated Value: $1,208,000 - $1,556,000
5
Beds
4
Baths
4,800
Sq Ft
$289/Sq Ft
Est. Value
About This Home
This home is located at 145 Richmond Valley Rd, Staten Island, NY 10309 and is currently estimated at $1,384,946, approximately $288 per square foot. 145 Richmond Valley Rd is a home located in Richmond County with nearby schools including P.S. 6 Cpl Allan F Kivlehan School, Is 34 Tottenville, and Tottenville High School.
Ownership History
Date
Name
Owned For
Owner Type
Purchase Details
Closed on
Feb 7, 2019
Sold by
Telmany Edward and Telmany Cheryl
Bought by
Telmany Mark and Telmany Deana
Current Estimated Value
Purchase Details
Closed on
Feb 9, 2006
Sold by
Telmany Cheryl
Bought by
Telmany Edward and Telmany Cheryl
Purchase Details
Closed on
Sep 30, 2005
Sold by
Lopez Nelson and Lopez Evelyn
Bought by
Telmany Cheryl
Home Financials for this Owner
Home Financials are based on the most recent Mortgage that was taken out on this home.
Original Mortgage
$496,000
Interest Rate
5.81%
Mortgage Type
Fannie Mae Freddie Mac
Purchase Details
Closed on
Mar 24, 1998
Sold by
Meyer Patricia
Bought by
Lopez Nelson and Lopez Evelyn
Home Financials for this Owner
Home Financials are based on the most recent Mortgage that was taken out on this home.
Original Mortgage
$256,500
Interest Rate
7.08%
Create a Home Valuation Report for This Property
The Home Valuation Report is an in-depth analysis detailing your home's value as well as a comparison with similar homes in the area
Home Values in the Area
Average Home Value in this Area
Purchase History
| Date | Buyer | Sale Price | Title Company |
|---|---|---|---|
| Telmany Mark | -- | Homestead Title Agency | |
| Telmany Edward | -- | None Available | |
| Telmany Cheryl | $621,500 | First Amer Title Ins Co Ny | |
| Lopez Nelson | $285,000 | -- |
Source: Public Records
Mortgage History
| Date | Status | Borrower | Loan Amount |
|---|---|---|---|
| Open | Telmany Mark | $650,000 | |
| Closed | Telmany Cheryl | $496,000 | |
| Previous Owner | Lopez Nelson | $39,000 | |
| Previous Owner | Lopez Nelson | $325,000 | |
| Previous Owner | Lopez Nelson | $256,500 | |
| Closed | Telmany Cheryl | $93,000 |
Source: Public Records
Tax History Compared to Growth
Tax History
| Year | Tax Paid | Tax Assessment Tax Assessment Total Assessment is a certain percentage of the fair market value that is determined by local assessors to be the total taxable value of land and additions on the property. | Land | Improvement |
|---|---|---|---|---|
| 2024 | $9,824 | $79,560 | $10,734 | $68,826 |
| 2023 | $9,459 | $46,574 | $9,715 | $36,859 |
| 2022 | $9,298 | $74,700 | $17,460 | $57,240 |
| 2021 | $9,554 | $61,860 | $17,460 | $44,400 |
| 2020 | $9,065 | $68,340 | $17,460 | $50,880 |
| 2019 | $8,527 | $66,000 | $17,460 | $48,540 |
| 2018 | $7,912 | $38,812 | $12,439 | $26,373 |
| 2017 | $7,912 | $38,812 | $12,425 | $26,387 |
| 2016 | $7,710 | $38,566 | $16,241 | $22,325 |
| 2015 | $5,511 | $30,440 | $15,790 | $14,650 |
| 2014 | $5,511 | $28,718 | $12,662 | $16,056 |
Source: Public Records
Map
Nearby Homes
- 15 Madsen Ave
- 7 Torrice Loop
- 156 Weiner St
- 10 Simon Ct
- 6716 Amboy Rd
- 23 Ferguson Ct
- 20 Averill Place
- 0 Wanier Ave Unit 2501299
- 4795 Arthur Kill Rd
- 6 Hale St
- 7 Parker St
- 90 Giegerich Ave
- 126 Craig Ave
- 170 Brehaut Ave
- 35 Jeffrey Place
- 101 Bedell Ave
- 7036 Amboy Rd
- 197 Craig Ave
- 66 Joline Ave
- 527 Page Ave