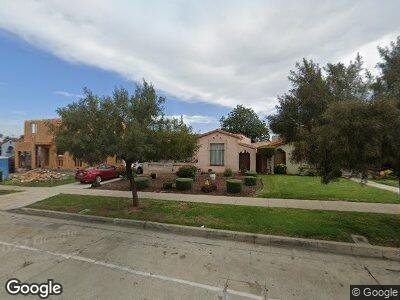
1452 W 83rd St Los Angeles, CA 90047
Manchester Square NeighborhoodEstimated Value: $597,825 - $703,000
2
Beds
1
Bath
1,137
Sq Ft
$564/Sq Ft
Est. Value
About This Home
This home is located at 1452 W 83rd St, Los Angeles, CA 90047 and is currently estimated at $640,706, approximately $563 per square foot. 1452 W 83rd St is a home located in Los Angeles County with nearby schools including La Salle Avenue Elementary School, Horace Mann Ucla Community, and George Washington Preparatory High School.
Ownership History
Date
Name
Owned For
Owner Type
Purchase Details
Closed on
Mar 27, 2021
Sold by
Coleman Margaret L
Bought by
Margaret L Coleman Revocable Living Trust
Current Estimated Value
Purchase Details
Closed on
Jun 3, 2003
Sold by
Coleman Margaret L and Clarke Keith M
Bought by
Coleman Margaret L
Home Financials for this Owner
Home Financials are based on the most recent Mortgage that was taken out on this home.
Original Mortgage
$156,000
Interest Rate
6.12%
Mortgage Type
Purchase Money Mortgage
Purchase Details
Closed on
Jun 21, 2002
Sold by
Coleman Margaret L
Bought by
Coleman Margaret L
Purchase Details
Closed on
Feb 1, 2002
Sold by
Jones Dorothy R
Bought by
Coleman Margaret L
Home Financials for this Owner
Home Financials are based on the most recent Mortgage that was taken out on this home.
Original Mortgage
$120,000
Interest Rate
7.15%
Create a Home Valuation Report for This Property
The Home Valuation Report is an in-depth analysis detailing your home's value as well as a comparison with similar homes in the area
Home Values in the Area
Average Home Value in this Area
Purchase History
| Date | Buyer | Sale Price | Title Company |
|---|---|---|---|
| Coleman Margaret L | -- | Chicago Title Co | |
| Coleman Margaret L | -- | -- | |
| Coleman Margaret L | $150,000 | -- |
Source: Public Records
Mortgage History
| Date | Status | Borrower | Loan Amount |
|---|---|---|---|
| Open | Coleman Margaret L | $544,185 | |
| Closed | Coleman Margaret L | $222,000 | |
| Closed | Coleman Margaret L | $8,342 | |
| Closed | Coleman Margaret L | $29,500 | |
| Closed | Coleman Margaret L | $193,000 | |
| Closed | Coleman Margaret L | $156,000 | |
| Closed | Coleman Margaret L | $120,000 | |
| Closed | Coleman Margaret L | $15,000 |
Source: Public Records
Tax History Compared to Growth
Tax History
| Year | Tax Paid | Tax Assessment Tax Assessment Total Assessment is a certain percentage of the fair market value that is determined by local assessors to be the total taxable value of land and additions on the property. | Land | Improvement |
|---|---|---|---|---|
| 2024 | $3,053 | $241,018 | $188,641 | $52,377 |
| 2023 | $2,999 | $236,293 | $184,943 | $51,350 |
| 2022 | $2,867 | $231,661 | $181,317 | $50,344 |
| 2021 | $2,823 | $227,119 | $177,762 | $49,357 |
| 2019 | $2,741 | $220,385 | $172,491 | $47,894 |
| 2018 | $2,685 | $216,064 | $169,109 | $46,955 |
| 2016 | $2,560 | $207,677 | $162,544 | $45,133 |
| 2015 | $2,523 | $204,559 | $160,103 | $44,456 |
| 2014 | $2,539 | $200,553 | $156,967 | $43,586 |
Source: Public Records
Map
Nearby Homes
- 1513 W 83rd St
- 1526 W 83rd St
- 1428 W 84th St
- 8417 S Halldale Ave
- 1459 W 85th St
- 1345 W 84th Place
- 1526 W 85th St
- 1539 W 80th St
- 1250 W 83rd St
- 1653 W 83rd St
- 1707 W 83rd St
- 1231 W 84th St
- 1533 W 79th St
- 1231 W 84th Place
- 1261 W 80th St
- 1207 W 84th Place
- 7818 Dalton Ave
- 7815 S Halldale Ave
- 7819 Dalton Ave
- 8734 Dalton Ave