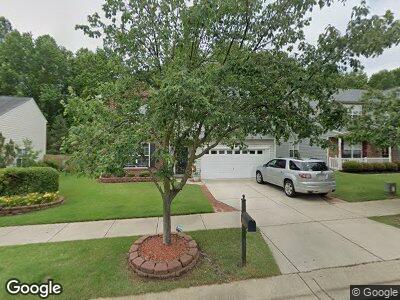
148 Chandler Springs Dr Holly Springs, NC 27540
Estimated Value: $450,000 - $508,000
4
Beds
3
Baths
2,734
Sq Ft
$176/Sq Ft
Est. Value
About This Home
This home is located at 148 Chandler Springs Dr, Holly Springs, NC 27540 and is currently estimated at $482,070, approximately $176 per square foot. 148 Chandler Springs Dr is a home located in Wake County with nearby schools including Holly Grove Elementary School, Holly Grove Middle School, and Holly Springs High School.
Ownership History
Date
Name
Owned For
Owner Type
Purchase Details
Closed on
Jul 7, 2006
Sold by
Baker Sidney Criswell and Baker Sherrie Renee
Bought by
Blackburn Martin P and Blackburn Lisa J
Current Estimated Value
Home Financials for this Owner
Home Financials are based on the most recent Mortgage that was taken out on this home.
Original Mortgage
$119,350
Interest Rate
8.87%
Mortgage Type
Purchase Money Mortgage
Purchase Details
Closed on
May 4, 2005
Sold by
Beazer Homes Corp
Bought by
Baker Sidney Criswell and Baker Sherrie Renee
Home Financials for this Owner
Home Financials are based on the most recent Mortgage that was taken out on this home.
Original Mortgage
$204,952
Interest Rate
5.99%
Mortgage Type
VA
Create a Home Valuation Report for This Property
The Home Valuation Report is an in-depth analysis detailing your home's value as well as a comparison with similar homes in the area
Home Values in the Area
Average Home Value in this Area
Purchase History
| Date | Buyer | Sale Price | Title Company |
|---|---|---|---|
| Blackburn Martin P | $217,500 | None Available | |
| Baker Sidney Criswell | $198,500 | -- |
Source: Public Records
Mortgage History
| Date | Status | Borrower | Loan Amount |
|---|---|---|---|
| Open | Blackbum Lisa J | $175,000 | |
| Closed | Blackburn Lisa J | $145,800 | |
| Closed | Blackburn Martin P | $119,350 | |
| Previous Owner | Baker Sidney Criswell | $204,952 |
Source: Public Records
Tax History Compared to Growth
Tax History
| Year | Tax Paid | Tax Assessment Tax Assessment Total Assessment is a certain percentage of the fair market value that is determined by local assessors to be the total taxable value of land and additions on the property. | Land | Improvement |
|---|---|---|---|---|
| 2024 | $3,980 | $462,065 | $100,000 | $362,065 |
| 2023 | $3,128 | $288,112 | $40,000 | $248,112 |
| 2022 | $3,020 | $288,112 | $40,000 | $248,112 |
| 2021 | $2,963 | $288,112 | $40,000 | $248,112 |
| 2020 | $2,963 | $288,112 | $40,000 | $248,112 |
| 2019 | $2,783 | $229,650 | $40,000 | $189,650 |
| 2018 | $2,516 | $229,650 | $40,000 | $189,650 |
| 2017 | $2,426 | $229,650 | $40,000 | $189,650 |
| 2016 | $2,392 | $229,650 | $40,000 | $189,650 |
| 2015 | $2,289 | $216,163 | $34,000 | $182,163 |
| 2014 | $2,210 | $216,163 | $34,000 | $182,163 |
Source: Public Records
Map
Nearby Homes
- 112 Smith Rock Dr
- 104 Abbeville Ln
- 112 Gadsbury Dr
- 428 Morgan Ridge Rd
- 120 Martingale Dr
- 0 Old Airport Rd
- 301 Martingale Dr
- 133 Alumroot Rd
- 112 Sire Ct
- 217 Carolina Town Ln
- 100 Sire Ct
- 0 High Pocket Dr
- 242 Luftee Ln
- 112 Carolina Town Ln
- 125 Occidental Dr
- 104 Somerset Farm Dr
- 521 Wildwood Farm Way
- 2027 Hayes Ln
- 1712 Avent Ferry Rd
- 117 Tiguan Ct