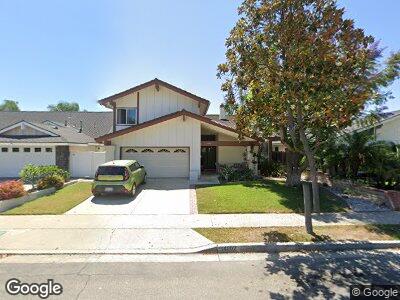
14802 Foxcroft Rd Tustin, CA 92780
Estimated Value: $1,249,000 - $1,365,275
4
Beds
3
Baths
2,243
Sq Ft
$592/Sq Ft
Est. Value
About This Home
This home is located at 14802 Foxcroft Rd, Tustin, CA 92780 and is currently estimated at $1,326,819, approximately $591 per square foot. 14802 Foxcroft Rd is a home located in Orange County with nearby schools including W. R. Nelson Elementary School, Sycamore Magnet Academy, and Tustin High School.
Ownership History
Date
Name
Owned For
Owner Type
Purchase Details
Closed on
Jun 29, 2010
Sold by
Scalzo Sally D
Bought by
Scalzo Sally D and The Scalzo Revocable Living Trust
Current Estimated Value
Purchase Details
Closed on
Mar 11, 2010
Sold by
Scalzo Sally D
Bought by
Scalzo Sally D
Home Financials for this Owner
Home Financials are based on the most recent Mortgage that was taken out on this home.
Original Mortgage
$210,000
Interest Rate
5%
Mortgage Type
New Conventional
Purchase Details
Closed on
Oct 17, 2006
Sold by
Scalzo Sally D
Bought by
Scalzo Sally D and Scalzo Revocable Living Trust
Home Financials for this Owner
Home Financials are based on the most recent Mortgage that was taken out on this home.
Original Mortgage
$211,500
Interest Rate
6.46%
Mortgage Type
Unknown
Purchase Details
Closed on
Jan 12, 2006
Sold by
Scalzo Sally D
Bought by
Scalzo Sally D and Scalzo Revocable Living Trust
Create a Home Valuation Report for This Property
The Home Valuation Report is an in-depth analysis detailing your home's value as well as a comparison with similar homes in the area
Home Values in the Area
Average Home Value in this Area
Purchase History
| Date | Buyer | Sale Price | Title Company |
|---|---|---|---|
| Scalzo Sally D | -- | None Available | |
| Scalzo Sally D | -- | None Available | |
| Scalzo Sally D | -- | Accommodation |
Source: Public Records
Mortgage History
| Date | Status | Borrower | Loan Amount |
|---|---|---|---|
| Open | Scalzo Sally D | $215,000 | |
| Closed | Scalzo Sally D | $210,000 | |
| Previous Owner | Scalzo Sally D | $211,500 | |
| Previous Owner | Scalzo Sally D | $200,000 | |
| Previous Owner | Scalzo Salvatore J | $50,000 | |
| Previous Owner | Scalzo Salvatore J | $40,000 |
Source: Public Records
Tax History Compared to Growth
Tax History
| Year | Tax Paid | Tax Assessment Tax Assessment Total Assessment is a certain percentage of the fair market value that is determined by local assessors to be the total taxable value of land and additions on the property. | Land | Improvement |
|---|---|---|---|---|
| 2024 | $527 | $155,815 | $34,189 | $121,626 |
| 2023 | $500 | $152,760 | $33,518 | $119,242 |
| 2022 | $475 | $149,765 | $32,861 | $116,904 |
| 2021 | $471 | $146,829 | $32,217 | $114,612 |
| 2020 | $489 | $145,324 | $31,887 | $113,437 |
| 2019 | $499 | $142,475 | $31,262 | $111,213 |
| 2018 | $516 | $139,682 | $30,649 | $109,033 |
| 2017 | $523 | $136,944 | $30,048 | $106,896 |
| 2016 | $526 | $134,259 | $29,459 | $104,800 |
| 2015 | $619 | $132,243 | $29,017 | $103,226 |
| 2014 | $600 | $129,653 | $28,449 | $101,204 |
Source: Public Records
Map
Nearby Homes
- 2221 Apple Tree Dr
- 111 Madrid
- 14411 Cherrywood Ln
- 1691 Green Meadow Ave
- 14761 Branbury Place
- 15205 Severyns Rd
- 1671 Green Meadow Ave
- 15221 Kensington Park Dr
- 1464 Valencia Ave
- 14882 Bridgeport Rd
- 1622 Darsy Cir
- 1442 Valencia Ave
- 2325 Dahlia Dr
- 164 Seville
- 104 Malaga Unit 104
- 1881 Mitchell Ave Unit 117
- 1881 Mitchell Ave Unit 5
- 1777 Mitchell Ave Unit 51
- 1608 Mitchell Ave
- 101 Malaga St Unit 101