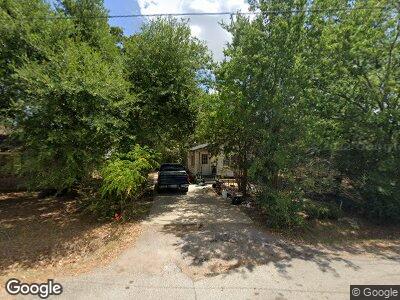
1505 Lopez St Bryan, TX 77803
Carver NeighborhoodEstimated Value: $105,495 - $141,000
3
Beds
1
Bath
740
Sq Ft
$170/Sq Ft
Est. Value
About This Home
This home is located at 1505 Lopez St, Bryan, TX 77803 and is currently estimated at $126,124, approximately $170 per square foot. 1505 Lopez St is a home located in Brazos County with nearby schools including Kemp-Carver Elementary School, Sam Rayburn Middle School, and Bryan High School.
Ownership History
Date
Name
Owned For
Owner Type
Purchase Details
Closed on
Mar 19, 2013
Sold by
Lewis Betty
Bought by
Cooks Gregory Carl
Current Estimated Value
Create a Home Valuation Report for This Property
The Home Valuation Report is an in-depth analysis detailing your home's value as well as a comparison with similar homes in the area
Home Values in the Area
Average Home Value in this Area
Purchase History
| Date | Buyer | Sale Price | Title Company |
|---|---|---|---|
| Cooks Gregory Carl | -- | None Available |
Source: Public Records
Tax History Compared to Growth
Tax History
| Year | Tax Paid | Tax Assessment Tax Assessment Total Assessment is a certain percentage of the fair market value that is determined by local assessors to be the total taxable value of land and additions on the property. | Land | Improvement |
|---|---|---|---|---|
| 2023 | $509 | $44,295 | $0 | $0 |
| 2022 | $883 | $40,268 | $0 | $0 |
| 2021 | $863 | $36,607 | $14,720 | $21,887 |
| 2020 | $798 | $34,820 | $10,408 | $24,412 |
| 2019 | $743 | $32,210 | $8,970 | $23,240 |
| 2018 | $675 | $27,510 | $6,670 | $20,840 |
| 2017 | $624 | $25,910 | $6,670 | $19,240 |
| 2016 | $567 | $23,020 | $5,230 | $17,790 |
| 2015 | $501 | $22,180 | $5,230 | $16,950 |
| 2014 | $501 | $20,850 | $5,230 | $15,620 |
Source: Public Records
Map
Nearby Homes
- 1304 Wellington Ave
- 1200 California St
- 1006 Boulevard St
- 1106 New York St
- 914 California St
- 906 California St
- 1309 W 17th St
- 1017 W 16th St
- 910 Chicago St
- 908 Chicago St
- 2907 Georgia Ave
- 1000 W 17th St
- 908 W 17th St
- 2703 Montana Ave
- 2222 Old Hearne Rd
- 00000 HWY 21 San Jacinto Ln
- 3300 State Highway 21 W
- 900 Columbus Ave
- 2901 Minnesota Ave
- 1009 Hunters Ln