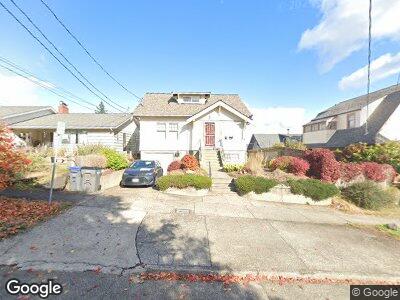
1508 7th St Bremerton, WA 98337
Estimated Value: $375,000 - $511,000
3
Beds
2
Baths
1,222
Sq Ft
$364/Sq Ft
Est. Value
About This Home
This home is located at 1508 7th St, Bremerton, WA 98337 and is currently estimated at $445,054, approximately $364 per square foot. 1508 7th St is a home located in Kitsap County with nearby schools including Naval Avenue Elementary School, Mountain View Middle School, and Bremerton High School.
Ownership History
Date
Name
Owned For
Owner Type
Purchase Details
Closed on
Dec 8, 2023
Sold by
Fournier Lynda S
Bought by
Embler Megan Zoe and Holland Chad
Current Estimated Value
Home Financials for this Owner
Home Financials are based on the most recent Mortgage that was taken out on this home.
Original Mortgage
$368,000
Outstanding Balance
$364,237
Interest Rate
7.79%
Mortgage Type
FHA
Estimated Equity
$101,159
Purchase Details
Closed on
Sep 22, 2006
Sold by
Atkinson Carol Jean and Cobler Royce Diane
Bought by
Fournier Lynda S
Home Financials for this Owner
Home Financials are based on the most recent Mortgage that was taken out on this home.
Original Mortgage
$224,000
Interest Rate
2%
Mortgage Type
Purchase Money Mortgage
Purchase Details
Closed on
Apr 3, 2002
Sold by
Larson Roy Henry and Larson Jean Elizabeth
Bought by
Atkinson Carol Jean and Cobler Royce Diane
Create a Home Valuation Report for This Property
The Home Valuation Report is an in-depth analysis detailing your home's value as well as a comparison with similar homes in the area
Home Values in the Area
Average Home Value in this Area
Purchase History
| Date | Buyer | Sale Price | Title Company |
|---|---|---|---|
| Embler Megan Zoe | $460,000 | Chicago Title | |
| Fournier Lynda S | $280,280 | Stewart Title Of Kitsap C | |
| Atkinson Carol Jean | -- | -- |
Source: Public Records
Mortgage History
| Date | Status | Borrower | Loan Amount |
|---|---|---|---|
| Open | Embler Megan Zoe | $368,000 | |
| Previous Owner | Fournier Lynda S | $178,000 | |
| Previous Owner | Fournier Lynda S | $217,450 | |
| Previous Owner | Fournier Lynda S | $221,000 | |
| Previous Owner | Fournier Lynda S | $224,000 |
Source: Public Records
Tax History Compared to Growth
Tax History
| Year | Tax Paid | Tax Assessment Tax Assessment Total Assessment is a certain percentage of the fair market value that is determined by local assessors to be the total taxable value of land and additions on the property. | Land | Improvement |
|---|---|---|---|---|
| 2025 | $3,360 | $380,810 | $75,710 | $305,100 |
| 2024 | $3,242 | $380,810 | $75,710 | $305,100 |
| 2023 | $3,351 | $380,810 | $75,710 | $305,100 |
| 2022 | $3,113 | $318,080 | $63,090 | $254,990 |
| 2021 | $2,885 | $269,750 | $47,660 | $222,090 |
| 2020 | $2,682 | $250,590 | $44,100 | $206,490 |
| 2019 | $2,317 | $224,250 | $39,370 | $184,880 |
| 2018 | $2,405 | $152,470 | $29,600 | $122,870 |
| 2017 | $1,997 | $152,470 | $29,600 | $122,870 |
| 2016 | $1,872 | $135,280 | $25,960 | $109,320 |
| 2015 | $1,561 | $112,270 | $28,240 | $84,030 |
| 2014 | -- | $107,330 | $28,240 | $79,090 |
| 2013 | -- | $114,660 | $29,810 | $84,850 |
Source: Public Records
Map
Nearby Homes