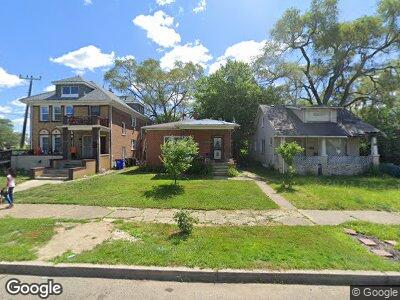
15106 Quincy St Detroit, MI 48238
Pilgrim Village NeighborhoodEstimated Value: $33,000 - $57,093
3
Beds
1
Bath
1,050
Sq Ft
$43/Sq Ft
Est. Value
About This Home
This home is located at 15106 Quincy St, Detroit, MI 48238 and is currently estimated at $44,773, approximately $42 per square foot. 15106 Quincy St is a home located in Wayne County with nearby schools including Thurgood Marshall Elementary-Middle School, Charles L. Spain Elementary-Middle School, and Edward 'Duke' Ellington Conservatory of Music and Art.
Ownership History
Date
Name
Owned For
Owner Type
Purchase Details
Closed on
Jan 13, 2016
Sold by
Wayne County Treasurer
Bought by
Detroit Land Bank Authority
Current Estimated Value
Purchase Details
Closed on
Mar 24, 2015
Sold by
Home Star Trading Co Llc
Bought by
Daniels Christa R
Purchase Details
Closed on
Aug 5, 2012
Sold by
Thor Real Estate Llc
Bought by
Home Star Trading Co Llc
Purchase Details
Closed on
Dec 21, 2009
Sold by
Thor Real Estate Llc
Bought by
Billlups Austin
Purchase Details
Closed on
Nov 13, 2008
Sold by
Et & St Investments Llc
Bought by
Thor Real Estate Llc
Purchase Details
Closed on
Jul 3, 2008
Sold by
Bryce Peters Financial Corp
Bought by
Et & St Investments Llc
Purchase Details
Closed on
May 8, 2008
Sold by
Deutsche Bank National Trust Co
Bought by
Bryce Peters Financial Corp
Purchase Details
Closed on
Apr 12, 2007
Sold by
Quates Clayton
Bought by
Deutsche Bank National Trust Co and Chase Funding Loan Acquisition Trust 200
Create a Home Valuation Report for This Property
The Home Valuation Report is an in-depth analysis detailing your home's value as well as a comparison with similar homes in the area
Home Values in the Area
Average Home Value in this Area
Purchase History
| Date | Buyer | Sale Price | Title Company |
|---|---|---|---|
| Detroit Land Bank Authority | -- | None Available | |
| Daniels Christa R | $101 | None Available | |
| Home Star Trading Co Llc | -- | None Available | |
| Billlups Austin | -- | None Available | |
| Thor Real Estate Llc | -- | None Available | |
| Et & St Investments Llc | -- | North American Title & Servi | |
| Bryce Peters Financial Corp | -- | First American Title | |
| Deutsche Bank National Trust Co | $52,548 | None Available |
Source: Public Records
Tax History Compared to Growth
Tax History
| Year | Tax Paid | Tax Assessment Tax Assessment Total Assessment is a certain percentage of the fair market value that is determined by local assessors to be the total taxable value of land and additions on the property. | Land | Improvement |
|---|---|---|---|---|
| 2024 | $815 | $26,300 | $0 | $0 |
| 2023 | $789 | $20,700 | $0 | $0 |
| 2022 | $854 | $16,900 | $0 | $0 |
| 2021 | $835 | $13,000 | $0 | $0 |
| 2020 | $803 | $11,100 | $0 | $0 |
| 2019 | $577 | $8,200 | $0 | $0 |
| 2018 | $240 | $0 | $0 | $0 |
| 2017 | $300 | $0 | $0 | $0 |
| 2016 | $240 | $0 | $0 | $0 |
| 2015 | $300 | $3,000 | $0 | $0 |
| 2013 | $377 | $3,774 | $0 | $0 |
| 2010 | -- | $5,005 | $704 | $4,301 |
Source: Public Records
Map
Nearby Homes
- 14890 Holmur St
- 15010 Fairfield St
- 14827 Petoskey Ave
- 3720 Fenkell Ave
- 7300 Ellsworth St
- 14853 Wildemere St
- 7326 Ellsworth St
- 15745 Holmur St
- 15348 Parkside St
- 6330 Midland St
- 15738 Livernois
- 15751 Fairfield St
- 15787 Belden St
- 6433 Globe St
- 14640 Livernois
- 15840 Dexter Ave
- 15389 Lawton St
- 15364 Lawton St
- 15802 Monica St
- 7369 Globe St