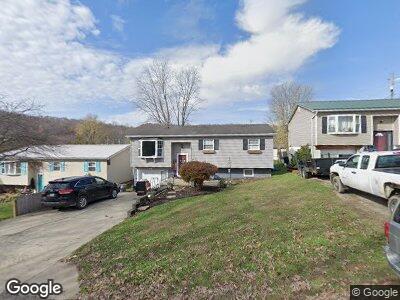
1515 9th St West Portsmouth, OH 45663
Estimated Value: $85,000 - $122,000
3
Beds
1
Bath
1,004
Sq Ft
$108/Sq Ft
Est. Value
About This Home
This home is located at 1515 9th St, West Portsmouth, OH 45663 and is currently estimated at $108,161, approximately $107 per square foot. 1515 9th St is a home located in Scioto County with nearby schools including Portsmouth West Elementary School, Portsmouth West Middle School, and Portsmouth West High School.
Ownership History
Date
Name
Owned For
Owner Type
Purchase Details
Closed on
Oct 28, 2022
Sold by
Lewis Alanna J
Bought by
Pierce Thomas A
Current Estimated Value
Home Financials for this Owner
Home Financials are based on the most recent Mortgage that was taken out on this home.
Original Mortgage
$111,111
Outstanding Balance
$107,681
Interest Rate
6.02%
Mortgage Type
New Conventional
Estimated Equity
$480
Purchase Details
Closed on
Apr 1, 2020
Sold by
Smith Joseph E and Smith Corinna A
Bought by
Leslie Alanna J
Home Financials for this Owner
Home Financials are based on the most recent Mortgage that was taken out on this home.
Original Mortgage
$74,000
Interest Rate
3.4%
Mortgage Type
New Conventional
Purchase Details
Closed on
Jun 13, 2018
Sold by
Smith Joseph E and Smith Corrina S
Bought by
Smith Joseph E and Smith Corrina S
Purchase Details
Closed on
Aug 10, 1998
Bought by
Smith Joseph E + Corinna
Create a Home Valuation Report for This Property
The Home Valuation Report is an in-depth analysis detailing your home's value as well as a comparison with similar homes in the area
Home Values in the Area
Average Home Value in this Area
Purchase History
| Date | Buyer | Sale Price | Title Company |
|---|---|---|---|
| Pierce Thomas A | $110,000 | Northwest Title | |
| Leslie Alanna J | $79,000 | None Available | |
| Smith Joseph E | -- | None Available | |
| Smith Joseph E + Corinna | $26,000 | -- |
Source: Public Records
Mortgage History
| Date | Status | Borrower | Loan Amount |
|---|---|---|---|
| Open | Pierce Thomas A | $111,111 | |
| Previous Owner | Leslie Alanna J | $74,000 |
Source: Public Records
Tax History Compared to Growth
Tax History
| Year | Tax Paid | Tax Assessment Tax Assessment Total Assessment is a certain percentage of the fair market value that is determined by local assessors to be the total taxable value of land and additions on the property. | Land | Improvement |
|---|---|---|---|---|
| 2024 | $1,682 | $21,990 | $1,540 | $20,450 |
| 2023 | $1,682 | $21,990 | $1,540 | $20,450 |
| 2022 | $1,106 | $21,990 | $1,540 | $20,450 |
| 2021 | $1,012 | $19,520 | $1,390 | $18,130 |
| 2020 | $1,007 | $19,520 | $1,390 | $18,130 |
| 2019 | $976 | $18,010 | $1,230 | $16,780 |
| 2018 | $1,019 | $18,010 | $1,230 | $16,780 |
| 2017 | $1,012 | $18,010 | $1,230 | $16,780 |
| 2016 | $1,005 | $17,540 | $1,230 | $16,310 |
| 2015 | $989 | $17,540 | $1,230 | $16,310 |
| 2013 | $836 | $17,540 | $1,230 | $16,310 |
Source: Public Records
Map
Nearby Homes
- 1233 13th St
- 1402 4th St
- 1601 16th St
- 1361 Terrace Rd
- 604 Jett St
- 605 Jett St
- 3852 Nauvoo-Pond Creek Rd
- 1259 Shepherd Fork Rd
- 306 Cole Ave
- 2411, 2521 2541 2609 2613 Argonne Rd Unit 5
- 2513 Argonne Rd
- 911 29th St
- 924 29th St
- 213 Warren Ave
- 2543 Richardson Rd
- 1035 22nd St
- 571 Bellamy Rd
- 1156 Kent St
- 2629 Sunrise Ave
- 2019 Sunrise Ave