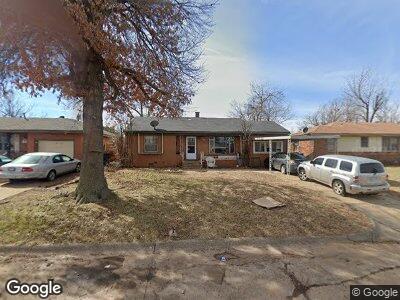
1516 SW 40th St Oklahoma City, OK 73119
Rancho Village NeighborhoodEstimated Value: $94,992 - $128,000
2
Beds
1
Bath
926
Sq Ft
$116/Sq Ft
Est. Value
About This Home
This home is located at 1516 SW 40th St, Oklahoma City, OK 73119 and is currently estimated at $107,248, approximately $115 per square foot. 1516 SW 40th St is a home located in Oklahoma County with nearby schools including Coolidge Elementary School, Roosevelt Middle School, and U. S. Grant High School.
Ownership History
Date
Name
Owned For
Owner Type
Purchase Details
Closed on
Nov 3, 2014
Sold by
Dorado Karina and Dorado Pablo
Bought by
Am Homes Llc
Current Estimated Value
Purchase Details
Closed on
Feb 11, 2009
Sold by
Am Homes Llc
Bought by
Dorado Karina and Dorado Pablo
Home Financials for this Owner
Home Financials are based on the most recent Mortgage that was taken out on this home.
Original Mortgage
$57,000
Interest Rate
4.91%
Mortgage Type
Purchase Money Mortgage
Purchase Details
Closed on
Feb 6, 2009
Sold by
Clark Randolph E and The Evelyn Irena Clark Revocab
Bought by
Am Homes Llc
Home Financials for this Owner
Home Financials are based on the most recent Mortgage that was taken out on this home.
Original Mortgage
$57,000
Interest Rate
4.91%
Mortgage Type
Purchase Money Mortgage
Purchase Details
Closed on
Apr 16, 2007
Sold by
Clark Evelyn Irena
Bought by
Clark Evelyn Irena and Evelyn Irena Clark Revocable Trust
Create a Home Valuation Report for This Property
The Home Valuation Report is an in-depth analysis detailing your home's value as well as a comparison with similar homes in the area
Home Values in the Area
Average Home Value in this Area
Purchase History
| Date | Buyer | Sale Price | Title Company |
|---|---|---|---|
| Am Homes Llc | -- | None Available | |
| Dorado Karina | $59,000 | First American Title | |
| Am Homes Llc | $38,000 | First American Title | |
| Clark Evelyn Irena | -- | None Available |
Source: Public Records
Mortgage History
| Date | Status | Borrower | Loan Amount |
|---|---|---|---|
| Previous Owner | Dorado Karina | $57,000 | |
| Previous Owner | Am Homes Llc | $57,000 |
Source: Public Records
Tax History Compared to Growth
Tax History
| Year | Tax Paid | Tax Assessment Tax Assessment Total Assessment is a certain percentage of the fair market value that is determined by local assessors to be the total taxable value of land and additions on the property. | Land | Improvement |
|---|---|---|---|---|
| 2024 | $791 | $7,019 | $1,069 | $5,950 |
| 2023 | $791 | $6,684 | $1,155 | $5,529 |
| 2022 | $717 | $6,366 | $1,242 | $5,124 |
| 2021 | $681 | $6,063 | $1,425 | $4,638 |
| 2020 | $654 | $5,775 | $1,499 | $4,276 |
| 2019 | $684 | $6,063 | $1,475 | $4,588 |
| 2018 | $654 | $5,775 | $0 | $0 |
| 2017 | $659 | $5,829 | $1,422 | $4,407 |
| 2016 | $647 | $5,719 | $1,422 | $4,297 |
| 2015 | $633 | $5,536 | $1,422 | $4,114 |
| 2014 | $630 | $5,547 | $1,422 | $4,125 |
Source: Public Records
Map
Nearby Homes
- 4025 Rancho Dr
- 16024 Zamora Ln
- 1413 Reding Dr
- 1545 SW 45th St
- 1317 SW 43rd St
- 2225 SW 38th St
- 2123 SW 46th St
- 2141 SW 35th St
- 1437 SW 34th St
- 1209 SW 39th St
- 1221 SW 37th St
- 1317 Williams Dr
- 2216 SW 34th St
- 1120 SW 38th St
- 1430 Chestnut Dr
- 2505 SW 43rd St
- 2425 SW 35th St
- 1028 SW 34th St
- 1221 SW 50th St
- 2213 SW 51st St