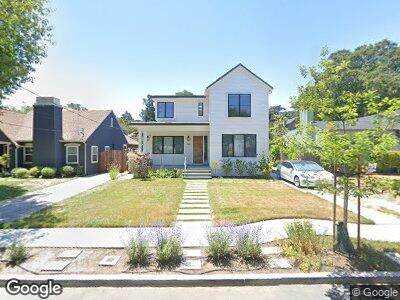
1523 Columbus Ave Burlingame, CA 94010
Easton Addition NeighborhoodEstimated Value: $4,426,000 - $4,571,000
4
Beds
4
Baths
3,051
Sq Ft
$1,480/Sq Ft
Est. Value
About This Home
This home is located at 1523 Columbus Ave, Burlingame, CA 94010 and is currently estimated at $4,514,397, approximately $1,479 per square foot. 1523 Columbus Ave is a home located in San Mateo County with nearby schools including Lincoln Elementary School, Burlingame Intermediate School, and Burlingame High School.
Ownership History
Date
Name
Owned For
Owner Type
Purchase Details
Closed on
Dec 28, 2022
Sold by
Lu Simon and Lu Theresa Ti-Hui
Bought by
Lu-Liu Family Trust
Current Estimated Value
Purchase Details
Closed on
Nov 27, 2019
Sold by
Brownrigg Michael G
Bought by
Lu Simon and Liu Theresa Ti Hui
Home Financials for this Owner
Home Financials are based on the most recent Mortgage that was taken out on this home.
Original Mortgage
$2,000,000
Interest Rate
2.12%
Mortgage Type
New Conventional
Purchase Details
Closed on
May 30, 2006
Sold by
Hulsmann Margaret J
Bought by
Brownrigg Michael G and D Margaret Burchell M
Home Financials for this Owner
Home Financials are based on the most recent Mortgage that was taken out on this home.
Original Mortgage
$650,000
Interest Rate
6.17%
Mortgage Type
Fannie Mae Freddie Mac
Create a Home Valuation Report for This Property
The Home Valuation Report is an in-depth analysis detailing your home's value as well as a comparison with similar homes in the area
Home Values in the Area
Average Home Value in this Area
Purchase History
| Date | Buyer | Sale Price | Title Company |
|---|---|---|---|
| Lu-Liu Family Trust | -- | -- | |
| Lu Simon | $3,995,000 | North American Title Co Inc | |
| Brownrigg Michael G | $1,250,000 | First American Title Company |
Source: Public Records
Mortgage History
| Date | Status | Borrower | Loan Amount |
|---|---|---|---|
| Previous Owner | Lu Simon | $2,000,000 | |
| Previous Owner | Brownrigg Michael G | $650,000 |
Source: Public Records
Tax History Compared to Growth
Tax History
| Year | Tax Paid | Tax Assessment Tax Assessment Total Assessment is a certain percentage of the fair market value that is determined by local assessors to be the total taxable value of land and additions on the property. | Land | Improvement |
|---|---|---|---|---|
| 2023 | $48,394 | $4,213,103 | $2,780,367 | $1,432,736 |
| 2022 | $46,658 | $4,130,494 | $2,725,850 | $1,404,644 |
| 2021 | $46,579 | $4,036,388 | $2,672,402 | $1,363,986 |
| 2020 | $45,609 | $3,995,000 | $2,645,000 | $1,350,000 |
| 2019 | $19,442 | $1,688,809 | $1,163,809 | $525,000 |
| 2018 | $17,328 | $1,501,299 | $1,140,990 | $360,309 |
| 2017 | $17,200 | $1,471,863 | $1,118,618 | $353,245 |
| 2016 | $16,568 | $1,443,004 | $1,096,685 | $346,319 |
| 2015 | $16,493 | $1,421,329 | $1,080,212 | $341,117 |
| 2014 | $16,334 | $1,393,488 | $1,059,053 | $334,435 |
Source: Public Records
Map
Nearby Homes
- 1596 Columbus Ave
- 2108 Hale Dr
- 1548 Balboa Way
- 1469 El Camino Real Unit 3
- 1476 Highway Rd
- 2606 Martinez Dr
- 1708 Toledo Ave
- 2813 Easton Dr
- 1431 Capuchino Ave
- 2156 Trousdale Dr
- 135 Newton Dr
- 10 Fagan Dr
- 845 Pinon Ave
- 1261 Vancouver Ave
- 1410 Capuchino Ave
- 55 Fagan Dr
- 1200 Jackling Dr
- 1153 Cabrillo Ave
- 2480 Summit Dr
- 2675 Summit Dr