1525 Medinah Rd Lawrence, KS 66047
Estimated Value: $382,263 - $432,000
3
Beds
3
Baths
2,698
Sq Ft
$148/Sq Ft
Est. Value
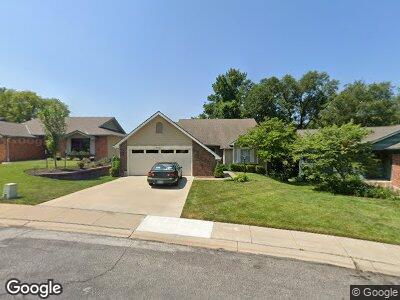
About This Home
This home is located at 1525 Medinah Rd, Lawrence, KS 66047 and is currently estimated at $398,566, approximately $147 per square foot. 1525 Medinah Rd is a home located in Douglas County with nearby schools including Hillcrest Elementary School, Southwest Middle School, and Lawrence High School.
Ownership History
Date
Name
Owned For
Owner Type
Purchase Details
Closed on
Feb 16, 2024
Sold by
Monsignor Vincent Edward Krische Trust
Bought by
Doost Babak Mardan and Veisi Masoumeh
Current Estimated Value
Home Financials for this Owner
Home Financials are based on the most recent Mortgage that was taken out on this home.
Original Mortgage
$365,750
Outstanding Balance
$362,097
Interest Rate
6.62%
Mortgage Type
New Conventional
Estimated Equity
$36,032
Purchase Details
Closed on
Nov 2, 2022
Sold by
Monsignor Vincent Edward Krische Trust
Bought by
Frank C Sabatini Trust
Purchase Details
Closed on
Jul 21, 2022
Sold by
Frank C Sabatini Trust
Bought by
Krische Vincent Edward
Purchase Details
Closed on
Apr 29, 2009
Sold by
Dirks Jane E and Dirks Aaron J
Bought by
Krische Vincent E
Home Financials for this Owner
Home Financials are based on the most recent Mortgage that was taken out on this home.
Original Mortgage
$254,190
Interest Rate
4.77%
Mortgage Type
Future Advance Clause Open End Mortgage
Create a Home Valuation Report for This Property
The Home Valuation Report is an in-depth analysis detailing your home's value as well as a comparison with similar homes in the area
Home Values in the Area
Average Home Value in this Area
Purchase History
| Date | Buyer | Sale Price | Title Company |
|---|---|---|---|
| Doost Babak Mardan | -- | Lawyers Title | |
| Krische Vincent Edward | -- | -- | |
| Krische Vincent E | -- | Commerce Title |
Source: Public Records
Mortgage History
| Date | Status | Borrower | Loan Amount |
|---|---|---|---|
| Open | Doost Babak Mardan | $365,750 | |
| Previous Owner | Krische Vincent E | $254,190 |
Source: Public Records
Tax History Compared to Growth
Tax History
| Year | Tax Paid | Tax Assessment Tax Assessment Total Assessment is a certain percentage of the fair market value that is determined by local assessors to be the total taxable value of land and additions on the property. | Land | Improvement |
|---|---|---|---|---|
| 2024 | $5,405 | $43,470 | $8,970 | $34,500 |
| 2023 | $4,674 | $36,386 | $6,624 | $29,762 |
| 2022 | $4,281 | $33,132 | $6,072 | $27,060 |
| 2021 | $3,855 | $28,888 | $5,796 | $23,092 |
| 2020 | $3,717 | $28,003 | $5,796 | $22,207 |
| 2019 | $3,569 | $26,933 | $5,796 | $21,137 |
| 2018 | $3,255 | $24,415 | $5,520 | $18,895 |
| 2017 | $3,139 | $23,288 | $5,520 | $17,768 |
| 2016 | $2,831 | $21,965 | $5,175 | $16,790 |
| 2015 | $2,629 | $20,424 | $0 | $20,424 |
| 2014 | $1,364 | $21,379 | $0 | $21,379 |
Source: Public Records
Map
Nearby Homes
- 1509 Alvamar Dr
- 1535 Alvamar Dr
- 4004 Vintage Ct
- 00000 W 13th St
- 1409 Lawrence Ave Unit B
- 1840 Quail Creek Dr
- 1501 Crossgate Dr
- 3408 Richard Ct
- 3604 Quail Creek Ct
- 1104 Cynthia St Unit A & B
- 1112 Cynthia St Unit A & B
- 1334 Westbrooke St
- 1358 Westbrooke St
- 1409 Westbrooke St
- 1025 Parkview Rd
- 1436 Westbrooke St
- 2104 Kasold Dr
- 2110 Greenbrier Dr
- 1704 Prestwick Dr
- 3918 W 10th Place