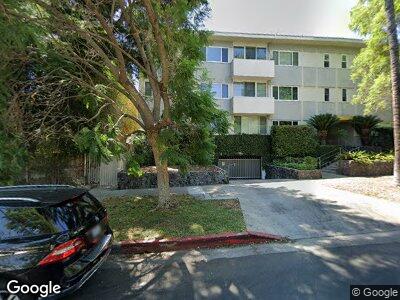
1525 N Hayworth Ave Unit 204 Los Angeles, CA 90046
Hollywood Hills West NeighborhoodEstimated Value: $629,000 - $845,000
1
Bed
2
Baths
1,092
Sq Ft
$683/Sq Ft
Est. Value
About This Home
This home is located at 1525 N Hayworth Ave Unit 204, Los Angeles, CA 90046 and is currently estimated at $745,516, approximately $682 per square foot. 1525 N Hayworth Ave Unit 204 is a home located in Los Angeles County with nearby schools including Gardner Street Elementary School, Hubert Howe Bancroft Middle School, and Fairfax High School.
Ownership History
Date
Name
Owned For
Owner Type
Purchase Details
Closed on
Feb 8, 2007
Sold by
Prejean Mary
Bought by
Capanni Michael
Current Estimated Value
Home Financials for this Owner
Home Financials are based on the most recent Mortgage that was taken out on this home.
Original Mortgage
$316,000
Interest Rate
6.87%
Mortgage Type
New Conventional
Purchase Details
Closed on
Feb 7, 2007
Sold by
Prejean Curtis A
Bought by
Prejean Mary
Home Financials for this Owner
Home Financials are based on the most recent Mortgage that was taken out on this home.
Original Mortgage
$316,000
Interest Rate
6.87%
Mortgage Type
New Conventional
Purchase Details
Closed on
Aug 27, 2001
Sold by
Tywang Rene
Bought by
Prejean Curtis A and Prejean Mary
Home Financials for this Owner
Home Financials are based on the most recent Mortgage that was taken out on this home.
Original Mortgage
$180,000
Interest Rate
7%
Purchase Details
Closed on
Mar 23, 2000
Sold by
Buell Catherine H
Bought by
Tywang Rene
Create a Home Valuation Report for This Property
The Home Valuation Report is an in-depth analysis detailing your home's value as well as a comparison with similar homes in the area
Home Values in the Area
Average Home Value in this Area
Purchase History
| Date | Buyer | Sale Price | Title Company |
|---|---|---|---|
| Capanni Michael | $395,000 | Equity Title Company | |
| Prejean Mary | -- | Equity Title Company | |
| Prejean Curtis A | $200,000 | Equity Title Company | |
| Tywang Rene | $155,000 | Equity Title Company |
Source: Public Records
Mortgage History
| Date | Status | Borrower | Loan Amount |
|---|---|---|---|
| Open | Capanni Michael | $450,000 | |
| Closed | Capanni Michael | $316,000 | |
| Closed | Prejean Mary | $79,000 | |
| Previous Owner | Prejean Curtis A | $180,000 |
Source: Public Records
Tax History Compared to Growth
Tax History
| Year | Tax Paid | Tax Assessment Tax Assessment Total Assessment is a certain percentage of the fair market value that is determined by local assessors to be the total taxable value of land and additions on the property. | Land | Improvement |
|---|---|---|---|---|
| 2024 | $6,468 | $518,823 | $387,481 | $131,342 |
| 2023 | $6,348 | $508,651 | $379,884 | $128,767 |
| 2022 | $6,083 | $498,679 | $372,436 | $126,243 |
| 2021 | $6,005 | $488,902 | $365,134 | $123,768 |
| 2019 | $5,761 | $474,402 | $354,304 | $120,098 |
| 2018 | $5,737 | $465,101 | $347,357 | $117,744 |
| 2016 | $5,451 | $447,043 | $333,870 | $113,173 |
| 2015 | $5,371 | $440,329 | $328,855 | $111,474 |
| 2014 | $5,395 | $431,705 | $322,414 | $109,291 |
Source: Public Records
Map
Nearby Homes
- 7949 Selma Ave Unit 18
- 1615 N Laurel Ave Unit 106
- 1615 N Laurel Ave Unit 112
- 1609 N Fairfax Ave
- 1538 N Crescent Heights Blvd
- 1621 N Fairfax Ave
- 1424 N Crescent Heights Blvd Unit 68
- 1414 N Fairfax Ave Unit 101
- 1400 N Hayworth Ave Unit 10
- 7965 Hollywood Blvd
- 1345 N Hayworth Ave Unit 1
- 1345 N Hayworth Ave Unit 110
- 1345 N Hayworth Ave Unit 109
- 8015 Hollywood Blvd
- 7918 Hillside Ave
- 7939 Hillside Ave
- 1342 N Crescent Heights Blvd Unit 2
- 8011 Fareholm Dr
- 1336 N Fairfax Ave
- 8116 Laurel View Dr