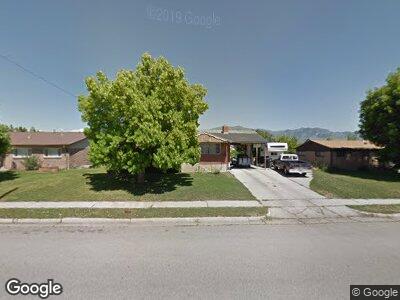
155 S 600 W Tremonton, UT 84337
Sandallwood Acres NeighborhoodEstimated Value: $334,000 - $380,762
--
Bed
--
Bath
972
Sq Ft
$364/Sq Ft
Est. Value
About This Home
This home is located at 155 S 600 W, Tremonton, UT 84337 and is currently estimated at $353,941, approximately $364 per square foot. 155 S 600 W is a home located in Box Elder County with nearby schools including McKinley School, Alice C. Harris Intermediate School, and Bear River Middle School.
Create a Home Valuation Report for This Property
The Home Valuation Report is an in-depth analysis detailing your home's value as well as a comparison with similar homes in the area
Home Values in the Area
Average Home Value in this Area
Tax History Compared to Growth
Tax History
| Year | Tax Paid | Tax Assessment Tax Assessment Total Assessment is a certain percentage of the fair market value that is determined by local assessors to be the total taxable value of land and additions on the property. | Land | Improvement |
|---|---|---|---|---|
| 2024 | $2,054 | $348,383 | $115,000 | $233,383 |
| 2023 | $2,059 | $343,014 | $110,000 | $233,014 |
| 2022 | $1,895 | $179,983 | $22,000 | $157,983 |
| 2021 | $1,386 | $186,161 | $40,000 | $146,161 |
| 2020 | $1,231 | $186,161 | $40,000 | $146,161 |
| 2019 | $1,154 | $93,140 | $22,000 | $71,140 |
| 2018 | $940 | $70,512 | $13,750 | $56,762 |
| 2017 | $986 | $128,203 | $13,750 | $103,203 |
| 2016 | $971 | $67,808 | $13,750 | $54,058 |
| 2015 | $885 | $62,894 | $13,750 | $49,144 |
| 2014 | $885 | $60,554 | $13,750 | $46,804 |
| 2013 | -- | $60,142 | $13,338 | $46,804 |
Source: Public Records