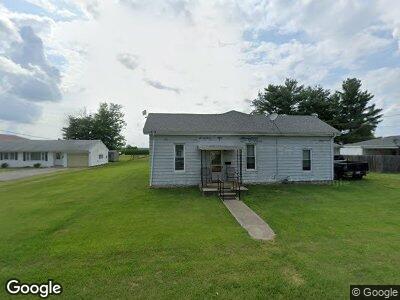
157 N Commercial St Winchester, IL 62694
Estimated Value: $64,474 - $81,000
--
Bed
--
Bath
1,376
Sq Ft
$53/Sq Ft
Est. Value
About This Home
This home is located at 157 N Commercial St, Winchester, IL 62694 and is currently estimated at $73,369, approximately $53 per square foot. 157 N Commercial St is a home located in Scott County with nearby schools including Winchester Elementary School and Winchester High School.
Ownership History
Date
Name
Owned For
Owner Type
Purchase Details
Closed on
Nov 1, 2010
Bought by
Howard Mark
Current Estimated Value
Create a Home Valuation Report for This Property
The Home Valuation Report is an in-depth analysis detailing your home's value as well as a comparison with similar homes in the area
Home Values in the Area
Average Home Value in this Area
Purchase History
| Date | Buyer | Sale Price | Title Company |
|---|---|---|---|
| Howard Mark | -- | -- |
Source: Public Records
Tax History Compared to Growth
Tax History
| Year | Tax Paid | Tax Assessment Tax Assessment Total Assessment is a certain percentage of the fair market value that is determined by local assessors to be the total taxable value of land and additions on the property. | Land | Improvement |
|---|---|---|---|---|
| 2023 | $812 | $17,138 | $4,454 | $12,684 |
| 2022 | $757 | $16,541 | $4,299 | $12,242 |
| 2021 | $686 | $15,778 | $4,101 | $11,677 |
| 2020 | $689 | $16,015 | $4,163 | $11,852 |
| 2019 | $738 | $16,107 | $4,187 | $11,920 |
| 2018 | $739 | $15,957 | $4,148 | $11,809 |
| 2017 | $697 | $15,307 | $3,979 | $11,328 |
| 2016 | $631 | $13,668 | $3,553 | $10,115 |
| 2015 | $574 | $13,260 | $3,447 | $9,813 |
| 2013 | $625 | $13,418 | $3,488 | $9,930 |
Source: Public Records
Map
Nearby Homes
- 222 N Main St
- 11 N Mechanic St
- 638 N Main St
- 227 S Main St
- 135 AC +/-
- 759 400 N
- 701 Alsey Smith Rd
- 115 Jackson St
- 1311 McGlasson Rd
- 330 S Florence Rd
- 208 Spring Bay Dr
- 1480 Illinois 100
- 1580 Middleton Rd
- 319 Superior St
- 411 Congress St
- 938 Cylinder Head Rd
- 455 N Plum St
- 226 N Jackson St
- 345 E North St
- 238 E Prairie St